Analyzer is a graphical network protocol decoder. It is a visual interface to NetSnoop that enables you to see, at a glance, summary information about packets you capture, layer-by-layer protocol information for packets, and the contents of packets in hexadecimal format.
Analyzer is also useful in a software development environment for distributed applications. By capturing packets of the protocol you are using, you can determine the sources, destinations, and contents of packets generated by your application and the order in which packets were transmitted. This information about how the application exchanged data can be invaluable in debugging.
Once a specified number of packets or type of packet is captured and stored, Analyzer decodes each stored packet, including protocol headers and data. The decoded information that appears in the three panes of the Analyzer main window includes:
packet information summaries
protocol analysis
hexadecimal and ASCII representations
The panes are synchronized for scrolling and viewing. Matching bytes are highlighted in all panes when they are selected in any pane to allow comparison of bytes between the three displays.
With Analyzer, you can analyze packets from several sources:
the default interface on your workstation (the default)
any interface on any Data Station that you are authorized on (see “Authorizing NetVisualyzer Users for Snooping” in Chapter 1 for details)
a data file created by NetSnoop
a data file created during a previous Analyzer session
By default, Analyzer captures, stores, and decodes all packets; however, you can specify a filter so that Analyzer stores only those packets that are of interest to you. In this case, Analyzer captures every packet and compares it against the filter. If a packet matches the filter, Analyzer stores that packet (for information about filters, see Chapter 10, “Creating and Using Filters”). You can also specify start and stop “trigger” conditions. Triggers enable you to specify that no packets should be stored until a particular filter is matched and that no more packets should be stored after a particular filter is matched.
Analyzer is a pure X application so you can run it on an X terminal.
This chapter explains how to:
start Analyzer
use the Capture control panel to specify the traffic you want to capture and store
use the Analyzer main window to display decoded packets
use the Analyzer File menu to save packets and configuration information
configure Analyzer for best performance
In addition, a variety of Analyzer examples are provided. For complete information on Analyzer command line options and resources, see the analyzer(1M) manual page in Appendix F, “NetVisualyzer Manual Pages.” Additional information about the Analyzer configuration file is provided in Appendix D, “Configuration File Formats.”
 | Note: You must have authorization to use Analyzer. See “Authorizing NetVisualyzer Users for Snooping” in Chapter 1 and Appendix B, “Authorization Reference,” for details. |
To start Analyzer, double-click the analyzer icon in the netvis directory view or type:
analyzer |
If the configuration file ~/.analyzerrc doesn't exist and you don't specify another file, the Analyzer main window and the Capture control panel appear in default locations; otherwise, they appear in locations specified in configuration file (their locations at the time .analyzerrc was created).
You can specify a configuration file on the Analyzer command line with the –u option or in the Analyzer resources file with the Analyzer*controlsFile resource.
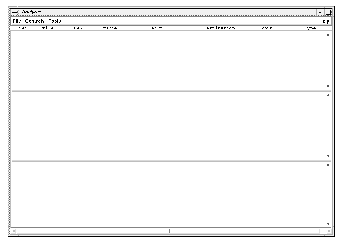
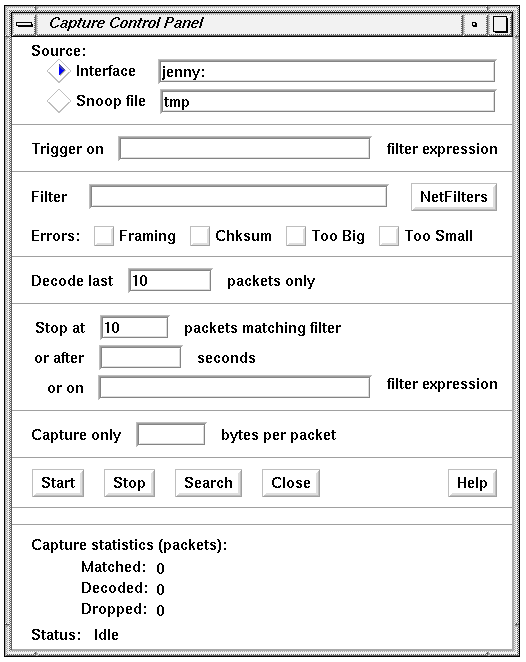
Figure 5-1 shows the Analyzer main window, and Figure 5-2 shows the Capture control panel.
The next two sections describe the Capture control panel and the Analyzer main window.
The Capture control panel enables you to specify options for capturing packets, to start and stop the capturing of packets, and search for packets. The following sections explain how to use this control panel to perform these tasks.
This section explains the entry fields, buttons, and status area sections of the Capture control panel.
You can capture packets from either a Data Station on the network or a previously saved file that contains captured packets. To specify a Data Station, select the Interface radio button (the default) as shown in Figure 5-3. By default, its entry field contains the name of your workstation followed by a colon. This specifies that packets should be captured using the default interface on your workstation using RPC snooping.

The format for specifying a Data Station and its interface is:
station:interface |
station is the node name of a Data Station that you want to use to capture packets, and interface is the interface that you want to use on that node. (Use the command netstat –i to list the interfaces for a workstation.) If the interface is not specified, Analyzer captures from the node's default interface. For example, to capture packets from the default interface on a Data Station named reddog, type:
reddog: |
If you want to snoop on an interface other than the default, you must specify it. For example, assume that reddog has an additional EFast™ Ethernet board installed and you wish to capture from it. Type:
reddog:fxp0 |
For a distributed environment in which a Data Station is connected to each network or segment, you can capture packets remotely. You must, however, have authorization in the /usr/etc/rpc.snoopd.auth file on each Data Station. Thus, you can use Analyzer to collect data from remote networks and to perform remote diagnostics from one location.
To analyze captured packets that have been saved in a file, select the Snoop file radio button and enter the file name in the entry field. Previously saved files can contain the output of NetSnoop (created by redirecting the output of NetSnoop to a file) or Analyzer (see “Save Packets” in this chapter).
Use the Trigger On entry field shown in Figure 5-4 to specify a filter expression to trigger the start of packet capture. When you enter a filter expression on this line, Analyzer does not start to capture packets until it sees a packet that matches the expression. Then all packets that match the Filter entry field are captured. If this entry field is empty, Analyzer begins capturing packets when you press the Start button.

You can use the NetFilters button in this window to start up NetFilters and to copy a filter from a filter repository to this entry field. To use NetFilters, make sure the insertion point is in this entry field, click the NetFilters button, and select the filter you want to use by double-clicking it. The filter automatically appears in the entry field. See Chapter 2, “NetFilters,” for more information about NetFilters.
A filter allows you to examine only the packets that interest you because only packets that match the given expression are stored. (Filters are described in detail in Chapter 10.) You can type the filter you want to use in the entry field shown in Figure 5-5 or you can use NetFilters. To use NetFilters, make sure the insertion point is in this entry field, click the NetFilters button, then select the filter you want to use by double-clicking it. The filter automatically appears in the entry field. If you leave this entry field blank, Analyzer stores all packets that it captures.

You can capture and store error packets by clicking one or more Errors check boxes (shown in Figure 5-6) for the desired errors. The errors you can capture are:
| Framing | Packet received, but with framing error | |
| Chksum | Packet received, but with CRC error | |
| Too big | Packet received, but truncated to fit buffer | |
| Too small | Packet received, but size less than minimum |

If you don't specify any errors, Analyzer captures only packets without errors. See “Capturing Errors” in Chapter 10 for information on filter expressions you can use to capture errors.
The Decode Last entry field shown in Figure 5-7 allows you to specify that you do not want all captured packets stored and decoded, just the last n packets (a post-trigger). This feature enables you to reduce the amount of memory used for stored packets since only n packets are stored. For example, to capture and store 1000 packets takes 1.5 Mb of memory (1000 x 1500, the maximum size of an Ethernet packet), but if you keep only 100 packets, just .15 Mb of memory is used.
If you leave the Decode Last entry field, shown in Figure 5-7, blank, Analyzer captures and decodes the number of packets you specified in the Stop At entry field. If the Stop At and Decode Last entry fields are blank, only one packet is captured and decoded.

Three Stop At entry fields allow you to specify when to stop capturing packets. To use the first Stop At entry field, shown in Figure 5-8, specify the number of packets matching the filter that you want to store. Analyzer captures and stores the specified number and then stops. The default is to capture one packet. If you leave this entry field and the next two blank, Analyzer captures indefinitely, or until you stop it using the Stop button.

To use the Or After entry field, shown in Figure 5-9, specify the length of time for the capture. For example, suppose you find that a time-out condition occurs after 30 seconds. You can capture packets for 30 seconds and then decode them to determine the cause of the time-out.

Enter a filter expression in the Or On entry field, shown in Figure 5-10. When a packet matches that expression, capturing stops. You can use the NetFilters button to start up NetFilters and copy a filter from a filter repository to this entry field. Put the insertion point in this entry field to make NetFilters copy a filter you select to this entry field.

You can specify more than one Stop At condition; when the first condition is met, Analyzer stops capturing packets.
By default, the Capture Only entry field shown in Figure 5-11 is blank, which means that Analyzer captures all bytes of each packet. When a number, n, is entered in this field, only the first n bytes of each captured packet are stored and decoded. The maximum number of bytes per packet for Ethernet is 1500 and for FDDI is 4352.

To start capturing, click the Start button. The status information at the bottom of the control panel changes from “Idle” to “Capturing.” If you entered a trigger expression in the Trigger On entry field, the status changes from “Idle” to “Waiting for Trigger.”
After you press Start, Analyzer checks filters and other values you've specified in the Capture control panel. If it detects any errors in what you've specified, the backgrounds of entry fields with errors become red and a Capture Warning dialog box appears with an error message.
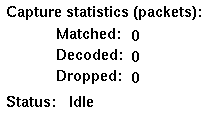
As packets are captured, the Capture statistics section at the bottom of the Capture control panel, shown in Figure 5-12, is updated to report the number of matched, decoded, and dropped packets, and the current status.
Analyzer stops capturing packets when one of the three Stop At conditions is met or when you click the Stop button.
After the specified packets are captured, they are decoded and the status in the lower left corner changes to “Decoding.” When all packets are decoded, the status returns to “Idle” and Analyzer's main window is updated with the newly captured packet information.
At times, Analyzer reports that packets are dropped, which means that the data you receive may not be complete. This happens when the interface or system buffers become full or other processes are using the CPU. See “Configuring Analyzer for Best Performance” in this chapter for more information.
The Search button enables you to apply a filter to already captured and decoded packets. Packets that do not match the filter are not displayed. To perform a search, configure the Capture control panel for your search, for example type a filter into the Filter entry field, and click the Search button.
For example, suppose you capture 200 packets and then decide that only the NFS packets are of interest to you. Replace the filter in the Filter entry field, if any, with the filter nfs and click Search. The Summary pane of the Analyzer main window changes to show only the packets with nfs in the Type column. You may decide to look at DECnet packets next. Replace the filter with decnet and click Search. All the DECnet packets from the 200 packets are displayed.
After you have captured and decoded packet data, the Analyzer main window displays packet information as shown in Figure 5-13.
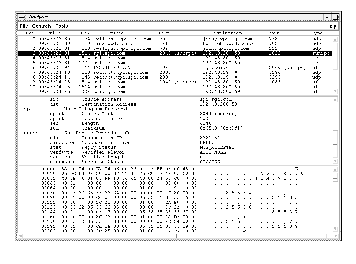
Analyzer's main window has three panes. Table 5-1 describes the functions of these panes. At startup, these panes are blank.
Table 5-1. Analyzer Main Window Panes
Pane Position | Pane Name | Function |
|---|---|---|
Top | Summary | |
Middle | Detail | |
Bottom | Hex Dump |
In the Analyzer main window, the left mouse button is your highlighting tool. In the Summary pane, use it to highlight a packet that you want to decode in the other panes. In the Detail pane, highlight an entry field, and the bytes that correspond to the entry field appear highlighted in the Hex Dump pane. In the Hex Dump pane, highlight a byte, and the entry fields that the byte represents appear highlighted in the Detail pane.
You can adjust the pane heights to maximize the display of information of interest to you without scrolling. Use the left mouse button to make the adjustment by dragging the separator up or down between the panes. As one pane grows, the pane next to it shrinks.
Scroll bars on the bottom and at the right of the main window enable you to scroll the panes. The bottom scroll bar is active only when you are displaying a packet with entry field(s) wider than the window or when you have sized the main window to less than its default width. In this case, use the bottom scroll bar to scroll all panes left and right. Each of the panes has a scroll bar on the right, which enables you to scroll the individual panes up and down.
The Detail and Hex Dump panes' scroll bars have an additional characteristic: you can use it to fix the first visible line position that you want to view for each packet you select. By default, when you select a packet in the Summary pane, the Detail and Hex Dump panes display from the first line of that packet. However, if you adjust the scroll bar so that the tenth line of a packet is the first line from the top that is visible, the next packet you select in the Summary pane is displayed starting from the tenth line. If the pane is big enough to show all the entry fields, the entire packet is displayed.
The Summary pane lists each packet in order of capture with the time of capture, the packet length, the source and destination nodes, and the protocol type.
For example, the Summary pane for a TCP packet looks like this:
Seq Time Len Source Port Destination Port Type 4 09:17:01.61 60 rachel.wpd.sgi.com 1017 eno.wpd.sgi.com 1016 tcp |
Table 5-2 defines the columns of the Summary pane.
Table 5-2. Summary Pane Columns
Column | Description |
|---|---|
Seq | Sequence in which the packet was captured |
Time | Time of capture |
Len | Length of the packet in bytes |
Source | Source node's name or address |
Port | Source port of the packet, if applicable, and possibly the port's name in parentheses |
Destination | Destination node's name or address |
Port | Destination port of the packet, if applicable, and possibly the port's name in parentheses |
Type | Protocol type |
The Detail pane decodes the packet highlighted in the Summary pane. It decodes protocol headers layer by layer and disassembles each layer field by field. An example of the decoded layers and fields for a TCP packet looks like this:
ether          Ethernet
          src        Source Address                           8:0:69:6:bd:d8/SGI
          dst        Destination Address                      8:0:69:2:27:73/SGI
          type       Packet Type                              ip
ip             Internet Protocol
          v          Version                                  4
          hl         Header Length                            5
          tos        Type of Service                          0
          len        Total Length                             40
          id         Identification                           17141
          off        Fragment Offset                          0
          ttl        Time to Live                             60
          p          Protocol                                 tcp
          sum        Header Checksum                          0x1c26
          src        Source Address                           rollon.wpd.sgi.com
          dst        Destination Address                      midas.wpd.sgi.com
tcp            Transmission Control Protocol
          sport      Source Port                              1023
          dport      Destination Port                         513 (rlogin)
          seq        Sequence Number                          43,968,243
          ack        Acknowledgment Number                    1,841,551,347
          off        Data Offset                              5
          flags      Flags                                    ACK
          win        Window                                   61,440
          sum        Checksum                                 0x6ad5
          urp        Urgent Pointer                           0
|
Notice how Analyzer decoded Ethernet, IP, and TCP layers. Table 5-3 lists and describes the fields decoded in this packet. When you decode a packet and want a description of a field, refer to that protocol's RFC or specification manual for information about its fields. See Appendix C, “Protocols,” for a list of references for the protocol specifications.
Table 5-3. Protocol Information in the Detail Pane
Field | Title | Description |
|---|---|---|
ether | Ethernet | Protocol name |
src | Source Address | Ethernet source address |
dst | Destination Address | Ethernet destination address |
type | Packet Type | The packet type (ip) |
ip | Internet Protocol | Protocol name |
v | Version | Version number |
hl | Header Length | Length of the header |
tos | Type of Service | Normal service |
len | Total Length | Length of the header and data |
id | Identification | A value in assembling fragments |
off | Fragment Offset | Indicates where in data a fragment belongs |
ttl | Time to Live | Time data allowed to remain in IP system |
p | Protocol | Protocol of next layer (tcp) |
sum | Header Checksum | Checksum on the header |
src | Source Address | IP source address |
dst | Destination Address | IP destination address |
tcp | Transmission Control Protocol | Protocol name |
sport | Source Port | Source port number |
dport | Destination Port | Destination port number |
seq | Sequence Number | Sequence number of first data octet |
ack | Acknowledgment Number | Value of next sequence number expected |
off | Data Offset | Indicates where data begins (multiples of 4) |
flags | Flags | Indicates Acknowledgment field significant (ACK) |
win | Window | Data sender is willing to accept |
sum | Checksum | Checksum of header and data |
urp | Urgent Pointer | Current value of the urgent pointer |
You may find the protocol fields in the Detail pane useful when you construct a filter. For example, you may want to use field names such as src, dst, sport, and dport when building a filter.
The Hex Dump pane provides a full listing of the packet highlighted in the Detail pane in both hexadecimal and ASCII formats. For example, the output of a TCP packet in the Hex Dump pane looks like this:
00000: 08 00 69 02 29 38 08 00 69 06 64 68 08 00 45 00 ..i.)8..i.dh..E. 00016: 00 28 16 D6 00 00 3C 06 23 6A C0 1A 4F 0B C0 66 .(....<.#j..O..f 00032: 75 04 03 FF 02 02 6D 44 A8 3A 6D 32 C9 FD 50 10 u.....mD.:m2..P. 00048: EF 88 29 0B 00 00 00 20 00 01 00 20 ..).... ... |
The left column gives the byte offset of the first byte in the row. The middle section displays 16 bytes in hexadecimal. The right section displays those same bytes in ASCII. A dot (.) appears where the ASCII representation of the byte is not a printing character. Typically, the ASCII representation is useful only when the packet contains ASCII text.
You can use the left mouse button in the Hex Dump pane to select the fields of the packet. Click the left mouse button on any character in the middle or right sections of the Hex Dump pane to highlight the field that includes that byte in the hex and ASCII sections of the Hex Dump pane and in the Detail pane.
The File menu enables you to save packets that you've captured and decoded to files and to exit Analyzer. The sections below describe the two choices on the “Save Packets” rollover menu, the two choices on the “Save Controls” rollover menu, and “Quit.”
The “As Snoop File...” choice on the “Save Packets” rollover menu enables you to save stored packets to a file. When you choose “As Snoop File...”, a file prompter window appears. Use it to specify a file name (see “Using a File Prompter” in the Introduction for more details). You can view these packets with Analyzer again by selecting Snoop file radio button as the source in the Capture control panel and specifying this file name.
You can save packets captured by Analyzer in a text file whose format is similar to the three panes of Analyzer. To do this, choose “As Text File...” from the “Save Packets” rollover menu. The dialog box shown in Figure 5-14 appears. Specify the packets you want to save in one of two ways: select the packets in the Summary pane of the Analyzer main window, or enter a packet number sequence in the entry field of the dialog box. A packet number sequence can be a single packet number, a packet number range, for example 100-200, or the word all. Use the check boxes to specify which information (panes) you want to save (Summary, Detail, and/or Hex Dump).
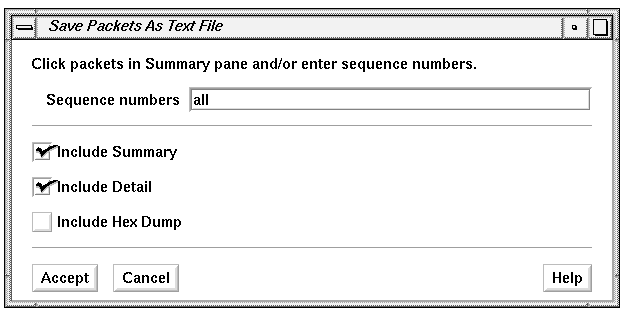
When you click Accept, a file prompter window appears. Use it to specify the file to which you want to save this “Analyzer main window look-alike” version of the decoded packets. The information is appended to the file and appears one packet at a time. For example, if you request Summary, Detail, and Hex Dump information, Analyzer generates a Summary line for each packet followed by the decoding of the protocol layers from the Detail pane, and the hex and ASCII versions from the Hex Dump pane, as shown below.
+++

Seq     Time   Len Source        Port   Destination         Port           Type
0 15:53:09.16  154 192.26.72.5   1023   maddog.wpd.sgi.com  2049 (sunrpc)  nfs

 ether          Ethernet
           src        Source Address                8:0:69:2:26:11/SGI
           dst        Destination Address           2:cf:1f:e0:81:55/CMC
           type       Packet Type                   ip
 ip             Internet Protocol
           v          Version                       4
           hl         Header Length                 5
           tos        Type of Service               0
           len        Total Length                  140
           id         Identification                44143
           off        Fragment Offset               0
           ttl        Time to Live                  58
           p          Protocol                      udp
           sum        Header Checksum               0x7583
           src        Source Address                192.26.72.5
           dst        Destination Address           maddog.wpd.sgi.com
 udp            User Datagram Protocol
           sport      Source Port                   1023
           dport      Destination Port              2049 (sunrpc)
           len        Length                        120
           sum        Checksum                      0x33f9
 sunrpc         Sun Remote Procedure Call
           xid        Transaction ID                13041
           direction  Message Direction             CALL
           rpcvers    RPC Version Number            2
           prog       Program Number                nfs
           vers       Version Number                2
           proc       Procedure Number              16
           credtype   Credential Flavor             AUTH_UNIX
           credlen    Credential Length             32
           cred       Call Credentials              moose:1274.10,10
           verftype   Verifier Flavor               AUTH_NULL
           verflen    Verifier Length               0
 nfs            Sun Network File System
           proc       Procedure                     READDIR
           fh         File Handle                   1e00:4794 [1e00 a0000 12ba 29ceb8f2 a 0 229ce b8f20000]
           offset     Offset                        0
           count      Count                         4096

00000: 02 CF 1F E0 81 55 08 00 69 02 26 11 08 00 45 00   .....U..i.&...E.
00016: 00 8C AC 6F 00 00 3A 11 75 83 C0 1A 48 05 C0 30   ...o..:.u...H..0
00032: 96 1E 03 FF 08 01 00 78 33 F9 00 00 32 F1 00 00   .......x3...2...
00048: 00 00 00 00 00 02 00 01 86 A3 00 00 00 02 00 00   ................
00064: 00 10 00 00 00 01 00 00 00 20 2A AD 2E D5 00 00   ......... *.....
00080: 00 05 6D 6F 6F 73 65 00 00 00 00 00 04 FA 00 00   ..moose.........
00096: 00 0A 00 00 00 01 00 00 00 0A 00 00 00 00 00 00   ................
00112: 00 00 00 00 1E 00 00 0A 00 00 00 00 12 BA 29 CE   ..............).
00128: B8 F2 00 00 00 0A 00 00 00 00 00 02 29 CE B8 F2   ............)...
00144: 00 00 00 00 00 00 00 00 10 00                     ..........
|
The “Save Controls” choice enables you to save user interface configuration information. This choice has a rollover menu with two choices, “Save” and “Save As...”. These choices save user interface configuration information to the file ~/.analyzerrc or to a file name of your choice. When you choose “Save As...”, a file prompter window appears. Use the procedure in the section “Using a File Prompter” in the Introduction to specify the file name for the user interface configuration data.
By default, the file ~/.analyzerrc is read when you start Analyzer; you can specify a different network configuration file at startup with the –u command line option.
To exit Analyzer, select “Quit” from the File menu. An Analyzer Question window appears. To save the current Capture control panel settings in the file shown in the message and to quit Analyzer, click the Yes button. To quit without saving configuration information, click the No button. If you want to write the information to another file or decide not to quit NetLook, click the Cancel button.
This section gives recommendations designed to minimize the possibility that Analyzer will drop packets and to maximize Analyzer performance. They are conservative recommendations that allow for worst-case network traffic scenarios and should be used as starting points for adjusting the values to your needs.
When using Analyzer, the following values in the Capture control panel give the best results:
The Capture Only entry field should be set to about 200. Seventy bytes gives optimal results, but if you are looking at NFS or AFP protocol headers, a setting of 70 does not show all of the fields.
The Stop At entry field should be set to less than 200 packets.
The Decode Last entry field should be set to less than 200.
The Filter entry field should contain a simple protocol expression that can be translated into the kernel's filter string so that the kernel, instead of snoopd, can do filtering. Some examples are:
src == 8:0:69:4:0:16
ip
host(8:0:69:1f:0:4)
Other NetVisualyzer tools should not be run when you run Analyzer because they dramatically affect Analyzer performance. Dedicating the Display Station to Analyzer (no applications or services running beyond the minimum) also improves performance.
When you specify a value in the Stop At entry field, Analyzer's statistics for the number of packets dropped are accurate. They are also accurate when the Stop At and Or After entry fields in the Capture control panel are blank (specifying free-running capture on the default interface until the Stop button is clicked).
When capturing is based on the Or After entry field or the Or On entry field, the number of dropped packets may be exaggerated. The number includes packets that were received but ignored after the packets of interest were detected at the interface.
The following sections explain three examples of using Analyzer. The first section lists the packets that are captured and stored for four different settings of the Capture control panel. The second example explains how to use the Decode Last entry field to investigate problems that happen just prior to a known event. The third example shows how to use Analyzer to record security intrusions.
Table 5-4 shows the packets that Analyzer stores during four sessions in which it captures identical packets. Each session has different specifications for the Trigger On, Filter, and Or On entry fields.
Table 5-4. Packets Stored for Four Settings of the Capture Control Panel
Packets Seen on the Network | Capture Control Panel Settings | Session 1 | Session 2 | Session 3 | Session 4 |
|---|---|---|---|---|---|
| Trigger on |
| nfs |
| nfs |
| Filter |
|
| tcp | tcp |
| or on filter expression |
| udp |
| udp |
udp |
| udp |
|
|
|
tcp |
| tcp |
| tcp |
|
tcp |
| tcp |
| tcp |
|
nfs |
| nfs | nfs |
|
|
tcp |
| tcp | tcp | tcp | tcp |
tcp |
| tcp | tcp | tcp | tcp |
nfs |
| nfs | nfs |
|
|
nfs |
| nfs | nfs |
|
|
tcp |
| tcp | tcp | tcp | tcp |
arpip |
| arpip | arpip |
|
|
tcp |
| tcp | tcp | tcp | tcp |
tcp |
| tcp | tcp | tcp | tcp |
udp |
| udp | udp |
|
|
tcp |
| tcp |
| tcp |
|
nfs |
| nfs |
|
|
|
tcp |
| tcp |
| tcp |
|
In Session 1, no expressions are given so Analyzer stores all packets it captures.
In Session 2, Analyzer waits for the Trigger On expression (nfs), stores all packets on the network because no filter to compare the packets to is specified, and stops capturing when it sees a UDP packet because udp was specified in the Or On entry field.
In Session 3, Analyzer stores only TCP packets because they match the tcp filter.
In Session 4, Analyzer waits for an NFS packet (the trigger), stores only TCP packets because they match the tcp filter, and stops capturing when it sees a UDP packet.
Suppose you know that a condition occurs after a certain number of packets (say, 200) are captured. You suspect that the last few packets cause the condition. Use a value in the Decode Last entry field as a post-trigger to store (and subsequently decode) only the last few captured packets. Capture 200 packets and store the last 20 that were captured by filling in Capture control panel entry fields as shown in Figure 5-15.
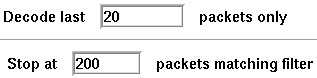
Analyzer captures 200 packets, stores the last 20 captured, and decodes these 20 packets.
As another example, suppose you know that a problem occurs before an NFS packet whose procedure field (proc) contains GETATTR. To view the last 30 packets before the GETATTR packet, specify Capture control panel entry fields as shown in Figure 5-16.
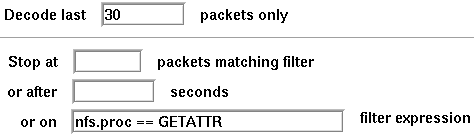
Analyzer captures all packets from the time you click the Start button, but it stores only the last 30 packets it has seen. It stops capturing when it finds a packet with nfs.proc equal to GETATTR, then decodes the 30 stored packets.
The example in “Using NetLook to Monitor Network Security Intrusions” in Chapter 3 describes how to use NetLook to identify a network security breach and trace its source. Often, however, just knowing that a breach has occurred and who the violator is may not be sufficient. To understand the implications of the breach, you may want to know exactly what transpired. For instance, were files copied or changed? Use Analyzer to help you rebuild what happened; it records a network intrusion in its entirety, packet by packet.
To set up Analyzer to capture packets:
In the Filter entry field of the Capture control panel, enter this filter expression to capture all traffic packets into and out of secret:
host secret
Or instead of secret's name, you can enter its IP address.
Make sure no Errors check boxes are checked (the default).
Remove any filters in the Or On entry field.
In the Decode Last entry field, enter 5000 packets (or any number that you expect to capture during the entire monitoring period).
Click Start to start capturing packets. Whenever a packet involving secret is captured, the count for matched packets in the Capture statistics portion of the control panel increments by 1.
When you return, click the Stop button.
The information in the Summary pane of the Analyzer main window tells you a great deal about the nature of the communication between secret and the potential intruders. The timing information tells when the intrusion occurred. The node data tells who the intruders are. The port data tells what kind of activities occurred. For example, if destination port 513 (a well-known port for rlogin(1C)) is detected, it is an indication that someone tried to log in from a remote workstation. (Give the command cat /etc/services in a shell window to see a list of well-known ports.)
The middle and bottom panes provide more detailed information, such as the sequencing of the packets. You can use this information to discover how the two nodes exchanged information. For example, to determine whether the intruder succeeded in a remote login to secret, use the middle pane to decode the packet's protocol header layer by layer down the protocol stack, and field by field at each layer. Thus you can see the interactions between secret and the intruder and the status of the login attempt.
You can also use the hexadecimal and ASCII dumps in the bottom pane to look for messages sent from secret to the intruder. For example, a packet with the message “login incorrect” indicates that the user could not log in because he or she did not enter the correct password.