NetTop gives you a graphical view of the volume of network traffic between selected nodes in your network. For example, it can provide you with a real-time display indicating the source and destination nodes with the highest volume of packets or bytes or the volume of traffic that matches filters you specify at particular nodes. With its rotatable 3-D bar graphs, you can see at a glance the total and relative volume of traffic at nodes of interest to you.
This chapter explains how to:
start NetTop
use the NetTop main window to display real-time traffic volume information
use the NetTop control panels to specify the type of traffic you want to view and configure the display of traffic
use the NetTop File menu
In addition, several examples are provided. For complete information on NetTop command line options and resources, see the nettop(1M) manual page in Appendix F, “NetVisualyzer Manual Pages.” Additional information about the NetTop configuration file is provided in Appendix D, “Configuration File Formats.”
 | Note: You must be authorized to use NetTop. See “Authorizing NetVisualyzer Users for Snooping” in Chapter 1 and Appendix B, “Authorization Reference,” for details. |
To start NetTop, double-click the nettop icon in the netvis directory view or enter:
nettop |
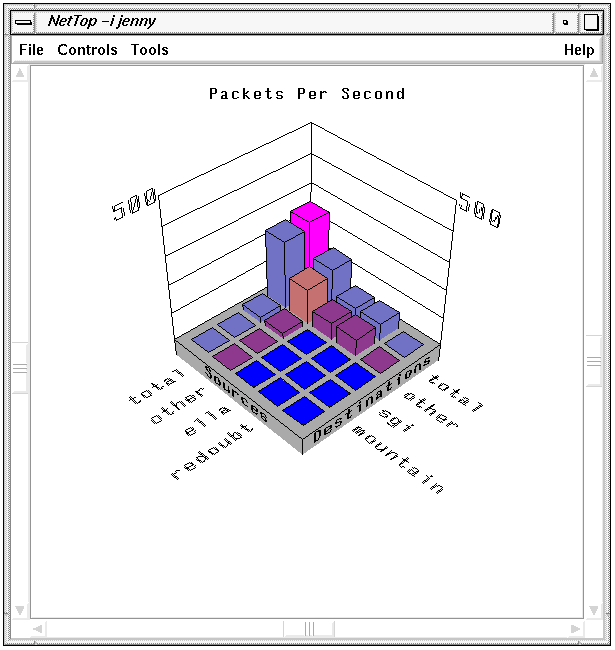
The NetTop main window appears. An example of the NetTop main window is shown in Figure 6-1.
By default, NetTop looks for the configuration file .nettoprc in your home directory. You can specify a configuration file on the NetTop command line with the –u option or in the NetTop resources file with the NetTop*controlsFile resource.
By default, NetTop displays the network traffic between five source nodes and five destination nodes in packets per second. The sources and destinations shown are total, the total network traffic on this network segment; other, the difference between total and the specific sources or destinations shown; and three specific source and destination nodes. By default, the three source and destination nodes are read from the file .nettoprc or are blank if no .nettoprc file is found at startup.
Each tower represents the number of packets between its source and its destination nodes per second. This number is calculated over intervals (the default is 1 second) and displayed at the end of each interval. Scale lines are shown on the “back” two sides of the 3-D graph. The top scale line is labeled with the number of packets or bytes per second. This number is rescaled up as often as needed and rescaled down after 5 seconds if the traffic level drops. See “NetTop Traffic Control Panel” in this chapter for more information about the rescaling of the scale lines.
The NetTop main window scroll bars enable you to rotate and scale the NetTop graph. The three scroll bars are:
| Right scroll bar – tilt |
| |
| Bottom scroll bar – spin |
| |
| Left scroll bar – zoom |
|
To return the graph to its initial position, press the <Home> key.
The horizontal axes of the graph are labeled with the node names, node addresses, or filters. Use the Nodes control panel to change the labels (see “NetTop Nodes Control Panel” in this chapter for more information). The labels can be in one of several colors:
| blue | Locked nodes and filters | |
| yellow | Selected nodes and filters | |
| green | Normal nodes and filters | |
| red | An error |
You can click on node names, filters, and towers to select them or deselect them if they are already selected. Clicking on a tower is equivalent to clicking on both of its node names or its node and filter. Selected towers, names and filters appear in yellow.
For selected towers, the source (or node) name, destination name (or filter), and the value of the highlighted tower are shown at the bottom of the main window. Figure 6-2 shows an example. The numeric value of the tower is updated as the graph is changed. When an entire row or column is selected, the numeric value is the value of the “total” tower in that row or column.
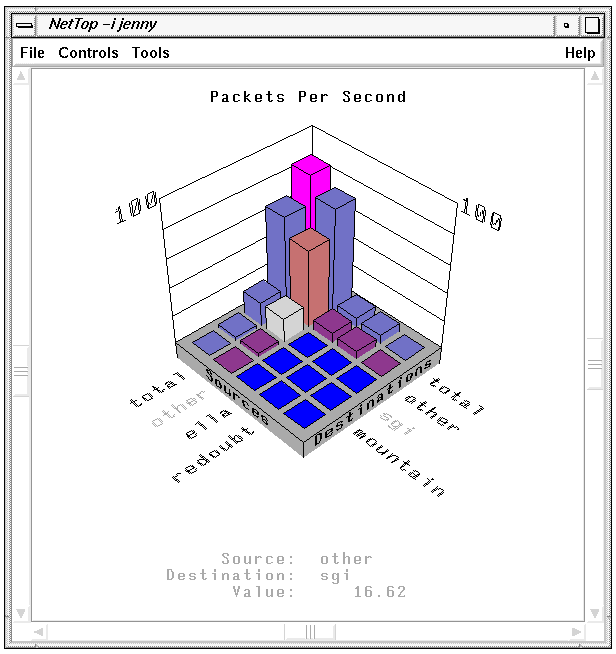
When NetTop is automatically updating the nodes shown on the horizontal axes with the currently busiest nodes, you can lock a particular tower by double-clicking it. Locking a node causes it to be displayed even when it is no longer among the busiest nodes or node pairs. You might want to lock a node pair, for instance, if you notice a very high volume of traffic for the pair and want to watch for a while to determine if the burst in traffic is sustained or not. See “NetTop Nodes Control Panel” in this chapter for more information about locking nodes.
The NetTop main window title bar includes “–i” and the interface on which it is snooping. The interface is in the same format as the argument to the –i command line option.
When you select “Traffic” from the Controls menu in the NetTop main window, the control panel shown in Figure 6-3 is displayed. This control panel enables you to change the way the NetTop graph displays traffic.

The Interface entry field shown in Figure 6-4 contains the name and/or interface of the node on which you are snooping. By default, NetTop snoops on the default interface of your workstation. You can specify the Data Station on which you want to snoop by entering it in this entry field and pressing <Enter>. You can specify another interface, possibly on a remote Data Station, on which to snoop using the format:
station:interface |

You can also specify an interface by starting NetTop with the –i option. Give the command netstat -i to see a list of configured interfaces. The NetTop main window title bar includes “–i” and the interface on which you are snooping.
You can limit the packets that are counted to a subset of interest to you by entering a filter in the Filter entry field shown in Figure 6-5. Type in the filter and press <Enter> or click the NetFilters button to view the NetFilters main window, then click on the filter you want to select it. The filter you select will appear in the Filter entry field. Using NetFilters is described in Chapter 2, “NetFilters.” Constructing filters is described in Chapter 10, “Creating and Using Filters.”

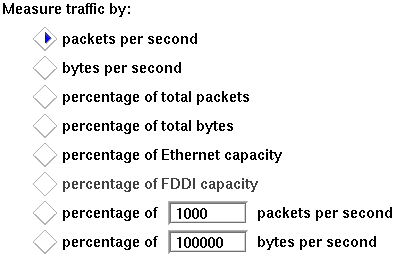
Each tower shows the traffic from source to destination that matches the filter entered above, or if nodes and filters are shown, each tower shows the traffic to and from each node that matches both the filter above and the filter for that tower. The section of the control panel shown in Figure 6-6 enables you to select the units used in displaying the traffic:
| packets per second |
| |
| bytes per second |
| |
| percentage of total packets |
| |
| percentage of total bytes |
| |
| percentage of Ethernet capacity |
| |
| percentage of FDDI capacity |
| |
| percentage of n packets per second |
| |
| percentage of n bytes per second |
|
The Update values option button shown in Figure 6-7 controls how often the new values of the towers are calculated (counting period). For instance, if 1 is shown on the option box, the counting period is one second and the towers are updated once every second to show the traffic data value obtained in the previous second. To change this value, press the option button and select one of the values in the menu that pops up.

If the Interpolate data option button shown in Figure 6-8 has the default value, 0, the tower heights are changed each time the new values are calculated at the end of each counting period specified by the option button above this line. The option button provides other values that specify how long a gradual increase or decrease to the new values should take: 10, 25, 50, 75, or 100% of the next counting interval.

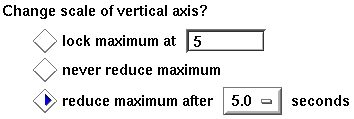
The Change scale radio buttons shown in Figure 6-9 enable you to control how the data is scaled:
| lock maximum at n |
| |
| never reduce maximum |
| |
| reduce maximum after n seconds |
|
When you select “Nodes” from the Controls menu in the NetTop main window, the control panel shown in Figure 6-10 is displayed. Its appearance depends on which radio buttons are selected. This control panel enables you to specify the source and destination nodes (or alternatively nodes and filters) shown in the NetTop graph. The Nodes control panel also enables you to specify the labels of the horizontal axes and the number of nodes and filters.
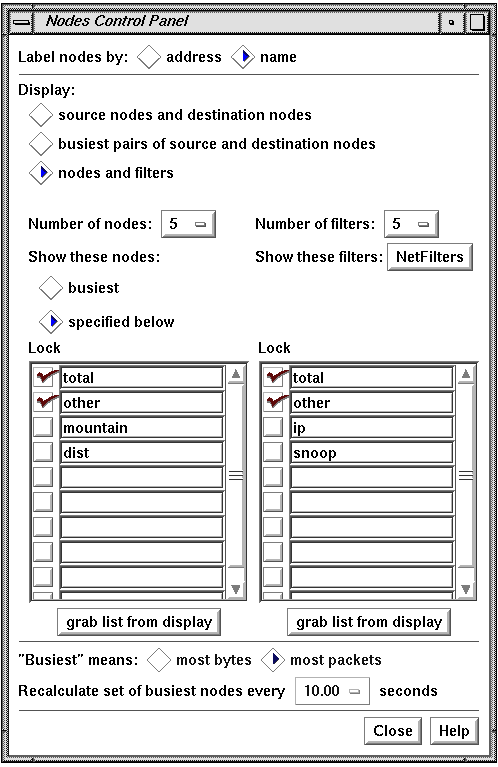
In the Label nodes section of the Nodes control panel shown in Figure 6-11 you can change how nodes are labeled. The choices are:
| name | If this radio button is checked, node names from /etc/hosts, NIS, or BIND are used to label one or both of the horizontal axes (for more information see “Address/Name Resolution” in Chapter 1). | |
| address | Node addresses are used as labels if this radio button is checked. It can be an IP address, DECnet address, or physical address, depending on the type of traffic. |

This setting is ignored for nodes whose names or addresses you've entered farther down in this control panel. For these nodes, the name or address you type is used.
The remainder of the Nodes control panel is used to specify what you want to display on the horizontal axes. The appearance of this section varies depending on which of the three Display buttons is chosen. The three versions are shown and described below.
When you choose the source nodes and destination nodes radio button as shown in Figure 6-12, two option buttons appear: one for the number of source nodes and one for the number of destination nodes. By default five sources and five destinations are displayed; you can use the option buttons to select different numbers.
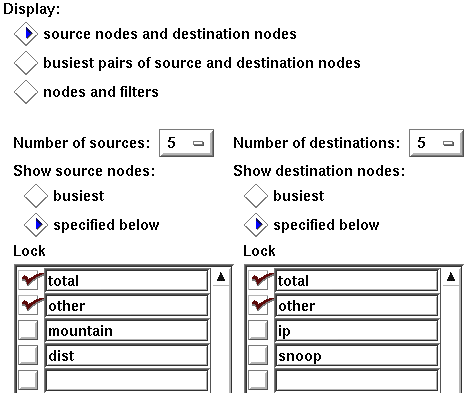
Using radio buttons, you can choose to display the busiest source and/or destination nodes, or specific nodes. If you select the specified below radio button, enter the node names or addresses in the entry fields below. Press <Enter> when you finish each name or address to make it appear on the graph in the main window.
When you choose the busiest radio button for source and/or destination nodes, you can use the “Lock” check boxes to specify that you want to continue to see a particular node in the NetTop main window, even if it is not among the busiest nodes.
When you select the busiest pairs of source and destination nodes radio button as shown in Figure 6-13, use the option button that appears to select the number of node pairs you want to view. You can show up to ten pairs. The busiest node pairs are node pairs that have the highest amount of traffic between them. How busy a node is can be measured in packets per second or bytes per second as specified by the radio buttons at the bottom of the window.
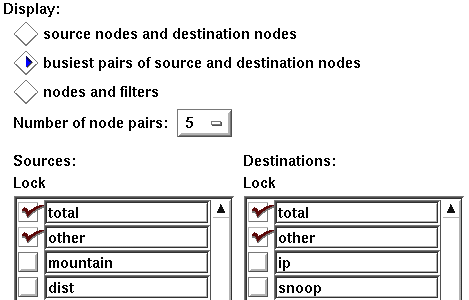
Two scrolling lists show source and destination node names. If the box is checked, the node is always displayed on the graph in the main window, whether it is busy or not.
When you put a check in a “Lock” check box, the node is displayed in the NetTop main window, even if it is not among the busiest nodes.
When you choose the nodes and filters radio button as shown in Figure 6-14, you can select the numbers of nodes and filters with option boxes. NetTop calculates and displays the busiest nodes if you select the busiest radio button in the “Show these nodes” section, or you can enter specific node names or addresses in the left display area as described above. In the right display area, enter each of the filters you want to use by typing them in or by starting NetFilters with the NetFilters button and copying filters from an archive. (See “Using NetFilters to Specify Filters for Other NetVisualyzer Tools” in Chapter 2 for information). By default, total and other are listed as filters: total means the total for all traffic and other means the total for all filters not explicitly listed.
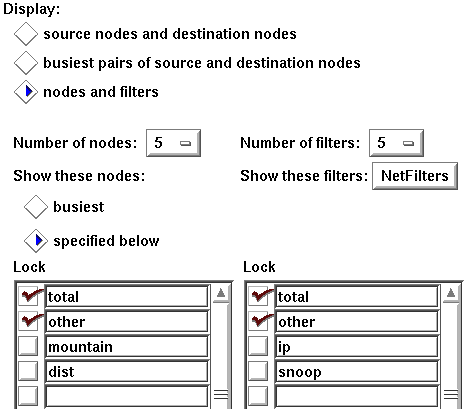
When you choose the busiest radio buttons, you can use the “Lock” check boxes to specify that you want to continue to see a particular node in the NetTop main window, even if it is not among the busiest nodes.
If you click one of the grab list from display buttons shown in Figure 6-15, the current list of nodes or filters in the display area above it is replaced with the nodes or filters currently displayed in the graph in the main window. This feature is useful when you want to fill in the list with the nodes or filters that are currently shown in the NetTop main window. If you lock these nodes and/or filters by checking their “Lock” check boxes, they remain on display even if the calculation of busiest nodes would otherwise make them disappear.

The line shown in Figure 6-16 enables you to specify how you want to define the term busiest. The busiest nodes have the highest volume of traffic. You can choose to measure the traffic in bytes per second or packets per second with these radio buttons. This line is grayed out when you specify nodes rather than when NetTop displays the busiest nodes.

The frequency of evaluating which nodes are the busiest is controlled by the line shown in Figure 6-17. It provides an option button with a list of choices of the number of seconds between calculations. If NetTop is not calculating busiest nodes, this option button is grayed out.

The File menu in the NetTop main window provides you with these choices:
| “Save Controls” |
| |
| “Save Controls As...” |
| |
| “Quit” | A NetTop Question window appears. To save the control panel settings in the file shown in the message and to quit NetTop, click the Yes button. To quit without saving configuration information, click the No button. If you want to write the information to another file or decide not to quit NetTop, click the Cancel button. |
This section provides a few examples and tips for using NetTop.
NetTop complements NetLook and NetGraph. It allows you to determine in real time the top contributors to network traffic like NetLook, but adds the third dimension to provide more analytical data on traffic volume. It also captures the identities of the top sources and destinations for subsequent analysis. NetTop can be used to spot interesting patterns in hosts or protocols dynamically. This information can then be used to tailor graphs in NetGraph. For example, it can be used to tell NetGraph where to look.
In your network you may have traffic patterns where a few nodes predominate: a few nodes generate traffic that is five or more times that of the average node. In this situation, the NetTop display clearly shows the very large towers for the top nodes, but the rest of the nodes appear as very short towers that move almost imperceptibly.
To create a clear display of the low towers, use the Traffic control panel and change the scale of the vertical axis. To determine an appropriate scale, select one of the taller short towers and watch the display at the bottom of the NetTop main window for a short period to get an idea of the maximum height of the short towers. Select the lock maximum radio button and enter this maximum in the entry field.
When the maximum is suited for the smaller towers, they “grow” to be visible, while the large towers “zoom” into the stratosphere. You can now use NetTop to view the average traffic nodes.
With the Nodes control panel, you specify the frequency that NetTop calculates the busiest nodes on the network. The selections offered range between 10 and 600 seconds because the general use of the tool is for dynamic capture and display.
NetTop can also be initialized to determine the busiest nodes over an extended period, for example hours or days. This can be handy to get a “bigger picture” of the key nodes or connections. NetCollect and NetAccount are useful in determining traffic statistics over longer intervals by source, destination and protocol. NetTop complements these tools by allowing you to specify a filter to ask questions like, “What are the top 5 NFS connections on my network over a 24-hour period?” NetTop can also be set to show the top connections rather than the individual sources and destinations as is reported by NetAccount.
To set NetTop for this mode, start it from the command line with the –T option and the number of seconds for the interval that you want to calculate the busiest nodes, for example 86400 for one day. Specify the –O option to generate a brief report of the results.
After NetTop begins, make your selections of filter, traffic measured in packets or bytes, number of source and destination, and so on according to your interest. In the Nodes control panel select either the source nodes and destination nodes radio button or the busiest pairs of source and destination nodes radio button. If you select the busiest pairs of source and destination nodes, also select the busiest radio button in the Show these nodes section. NetTop displays traffic as always and also generates a log in the window in which it was started.
An example of the log that results from executing the command:
nettop -T 3600 -O |
with a filter of nfs and specifying the busiest five pairs of source and destination nodes is:
For the 3600.0 seconds ending Tue Oct 13 17:34:18 PDT 1992, with filter: nfs the node pairs transmitting the most packets were: Source: 192.26.80.119 deepthought.wpd.sgi.com Dest: 192.26.75.45 mountain.wpd.sgi.com 37090 packets 5896820 bytes Source: 192.26.75.45 mountain.wpd.sgi.com Dest: 192.26.80.119 deepthought.wpd.sgi.com 34046 packets 9426816 bytes Source: 192.48.200.73 192.48.200.73 Dest: 192.26.75.5 sgi.sgi.com 21997 packets 3676242 bytes Source: 192.26.75.5 sgi.sgi.com Dest: 192.48.200.73 192.48.200.73 20438 packets 3208072 bytes Source: 192.26.75.11 gate-squaw.wpd.sgi.com Dest: 192.26.75.45 mountain.wpd.sgi.com |
Most networking environments have a few key workstations that function as servers for files, compute cycles, application, mail, or network news. Understanding the ebb and flow of their traffic and their connections to other machines can be important to maintaining an efficient network.
NetTop can be configured to always watch a server as either a source or destination and then to dynamically display its traffic.
To set NetTop to watch a specific node, in the Nodes control panel select the source nodes and destination nodes radio button, and select the specified below radio button in the Show source nodes section. Enter the name of the server in the first open field in the list. Set the Number of sources option button to 3 and the Number of destinations option button to 10.
You are now set to dynamically discover the top destinations for the server. The interval monitored can be set from the Nodes control panel or using the command line options –T and –O (described in “Calculating the Busiest Nodes over Extended Periods” in this chapter) to permit setting an extended interval.
You can also give a filter to view the server from the perspective of its NFS traffic. In the Traffic control panel enter the filter nfs.