This chapter contains important information for NetVisualyzer users:
“What Is NetVisualyzer?” presents a brief overview of the NetVisualyzer tools.
“NetVisualyzer Display Stations and Data Stations” explains the terms Display Station and Data Station.
“Snooping” explains how NetVisualyzer uses snooping to monitor and capture network traffic.
“SNMP Agents” explains how NetVisualyzer uses SNMP agents to query and set Management Information Base (MIB) variables.
“Event Logging” describes the event logging facility provided by NetVisualyzer tools.
“Setting Up NetVisualyzer” describes what you need to do to install NetVisualyzer software, enable network snooping, authorize NetVisualyzer users, and set up network license management.
“Using the netvis Directory View” explains how to use NetVisualyzer icons to start tools, view the online tutorial, and view manual pages.
“NetVisualyzer Gifts and Resources” describes the sample scripts (4Dgifts) and resource files that are included with NetVisualyzer software.
NetVisualyzer is a set of software products that you install on workstations on your network to observe (“snoop on”) network activity and capture packet data from the network. NetVisualyzer tools capture every packet of traffic on the network and graphically display packet data in a way that is easy to interpret.
With NetVisualyzer, you can answer questions such as:
Which hosts are responsible for most of the traffic on my network right now?
Which pairs of hosts have the most active conversations?
Does my network topology make sense? How can I engineer my network segments to avoid routing as much as possible?
How can I capture network traffic over time and analyze it later?
What protocols predominate on the network at different times of the day?
NetVisualyzer provides network visualization tools that show real-time traffic between hosts and between network segments, a protocol analyzer, a traffic accounting package, and much more.
Workstations with NetVisualyzer software installed are called NetVisualyzer Data Stations and/or NetVisualyzer Display Stations.
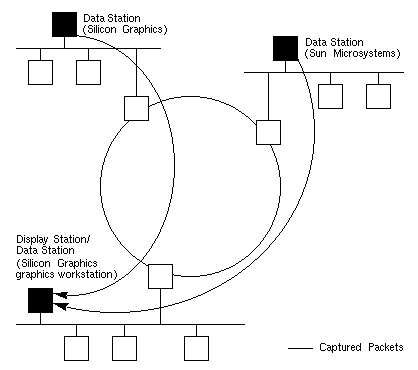
A Data Station is a Silicon Graphics or Sun Microsystems workstation that has NetVisualyzer Data Station software installed.
A Data Station need not have graphics. Its purpose is to capture data for reports or for viewing and analyzing on Display Stations. For optimal network management and analysis, it's best to have a Data Station connected to each network segment.
Display Stations are Silicon Graphics workstations with graphics that have NetVisualyzer Display Station software installed. (Analyzer, Browser, and NetFilters can be run on X Window System™ terminals rather than on a graphics workstation.) Display Stations should also have Data Station software installed to enable them to collect data locally. Since they can access data collected by all Data Stations on your network, one or more Display Stations can be used to monitor your entire network at once. Figure 1-1 shows an example of a network with this configuration.
The NetVisualyzer tools include NetLook, NetGraph, Analyzer, NetSnoop, NetTop, NetCollect, NetPack, NetAccount, Browser, and NetFilters:
Use NetLook to get an overall picture of the traffic patterns on the network. It displays your network's configuration, including its segments, hosts, routers, and traffic patterns.
NetGraph displays real-time moving strip charts showing the amount of network traffic.
Analyzer and NetSnoop capture and decode specific packets, enabling you to analyze packet protocol and data. Analyzer has a graphical user interface, while NetSnoop is a command-line utility.
NetTop shows the volume of traffic between pairs of nodes and the volume of traffic to or from a node. Its 3-D graph shows up to one hundred node pairs at a time, giving you can get real-time information about network traffic at a glance.
NetCollect, NetPack, and NetAccount capture network traffic over an extended period of time and generate statistical reports of that traffic.
Browser displays MIB information for a node. You can browse the MIB structure, getting and setting values.
NetFilters enables you to store and retrieve filters from archive files. This enables you to save frequently used filters and to quickly copy them for use with other NetVisualyzer tools.
 | Note: Most NetVisualyzer tools require that you have authorization on the Data Stations from which you are collecting network and node information. See “Authorizing NetVisualyzer Users for Snooping” and “Authorizing Browsing” in this chapter and Appendix B, “Authorization Reference,” for details. |
NetVisualyzer tools monitor network traffic by continuously capturing all of the packet traffic on their network segment. They “see” packets from one node on the segment bound for another node on that segment, and they “see” packets that are traversing their segment while bound for nodes on other segments in the network. Each NetVisualyzer tool's view of the network is formed by the packets that flow past its network tap.
The monitoring of packet traffic is also referred to as “snooping.” NetVisualyzer tools place the hardware interface into a promiscuous read mode and unobtrusively capture the information that permits each tool to provide different views of the network.
In a typical network, multiple network segments are joined by routers or non-transparent bridges. Segmented networks are used because they manage the flow of packets among user communities and, therefore, conserve bandwidth and improve the availability of the internet. To monitor the entire network, NetVisualyzer tools must be able to snoop on each distinct network segment. Data Station software does this packet monitoring.
Data Station software is usually installed on one node on each segment of the network. The Data Stations can all be controlled from a single Display Station. Display Station tools provide the user interface and graphical output that present the network's behavior visually. Multiple Display Stations support multiple users, organizations, or locations.
Two types of snooping are used by NetVisualyzer tools. One type of snooping, RPC snooping, uses the Sun Remote Procedure Call protocol to communicate with a Display Station. The RPC snooping daemon, snoopd(1M), does snooping, packet decoding, and filtering. snoopd's executable, rpc.snoopd, is started by the inetd(1M) daemon when a request for its service is received.
When a Display Station snoops on its own local interfaces, the other type of snooping, direct snooping, can be used. Direct snooping uses the IRIX kernel for snooping and bypasses snoopd completely. Direct snooping is available only to NetSnoop and Analyzer since these are the only tools that can request the return of full packets. Direct snooping provides the maximum performance at the sacrifice of the ability to connect to remote stations.
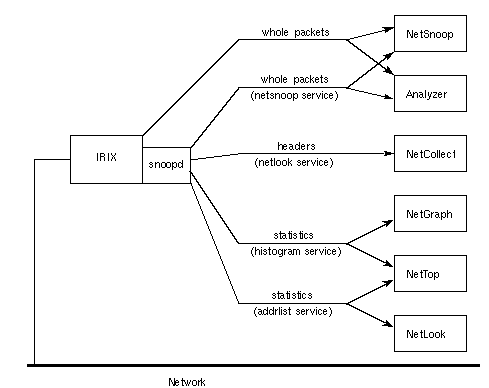
Each NetVisualyzer tool connects with snoopd and arranges for the services that it requires. snoopd returns either entire packets, portions of packets, or a distillation of the packets. Packets on the wire that are not of interest to you are not passed back by snoopd. Filter processing is performed on each Data Station, thus the packet traffic generated by NetVisualyzer is typically very small, less than a few percent of network bandwidth.
The packet-capturing services that snoopd provides to the NetVisualyzer tools are:
Figure 1-2 shows the relationship of the snoopd services to the NetVisualyzer tools.
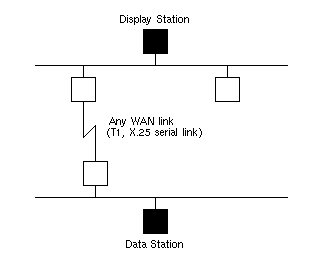
Distributed Data Stations send data to the central Display Station using the Internet Protocol (IP). Data Stations can forward the collected data to the Display Station through the local area network (LAN) medium through routers and bridges. In a wide-area network (WAN), Data Stations can forward data through any link, such as T1 or X.25, or any dial-up connection, such as serial line internet protocol (SL/IP), capable of passing IP packets (see Figure 1-3).
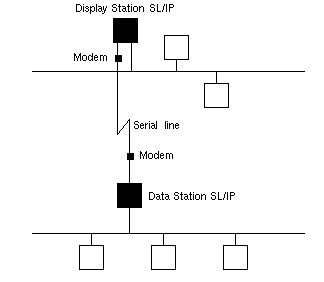
In both LANs and WANs, a dial-up connection from the Data Station to the Display Station also provides an out-of-band means of monitoring network traffic, as shown in Figure 1-4.
NetVisualyzer automatically resolves a node (host) name by using local files such as /etc/hosts or by accessing the NIS and/or BIND name servers if they are specified by the hostresorder and useyp resources (you can use the –y command-line option instead of useyp). If you use a name server to resolve names, you must activate the appropriate daemon on the Display and Data Stations. NetVisualyzer tools display the names returned by the name server. They may be local names or full domain names.
The –y command line option (and the equivalent resource useyp) of Analyzer, NetAccount, NetGraph, NetLook, and NetTop controls whether or not NIS is used to resolve names from IP addresses. NIS is often used for more than just resolving names from IP addresses. NIS may have maps for mapping Ethernet address to name, service names to port number, RPC names to program number, and so on (give the command ypwhich -m to see a list). The –y option enables or disables all of these maps. When the –y option isn't given, NIS is not used.
The hostresorder resource controls the order in which host lookup services are consulted when performing a host lookup based on name or IP address. Available services are NIS, BIND, and local files. Setting the hostresorder resource specifies the order in which these three services are tried. By default, the resource is set to local, which uses only the local files (and not NIS or BIND).
The –y option and hostresorder interact with each other in the following ways:
If hostresorder is set to local and you give the –y option, NIS is used for several maps, but it is not consulted when doing a host lookup based on name or IP address because hostresorder says use only local files.
If hostresorder is set to local nis and the –y option is not used, local files are tried first, and NIS is tried second. In this case, when a host lookup calls NIS for a query, NIS is off so it will just return with no match.
If hostresorder is set to local nis bind and you give the –y option, a host lookup will first try local files, then NIS, then BIND. Since NIS is now on, a query generates a request to the NIS server, which returns appropriately.
For information on NIS, see the NIS Administration Guide; for information on the BIND Name Server, see the IRIX Advanced Site and Server Administration Guide. For information on DECnet™ name resolution, turn to Chapter 11, “Using NetVisualyzer in a DECnet Environment.”
NetVisualyzer tools typically use snooping to obtain information. Browser, however, uses Simple Network Management Protocol (SNMP) agents to obtain information. The SNMP agent for Silicon Graphics workstations is snmpd(1M). Vendor-specific SNMP agents are used to obtain information about other types of nodes (see Figure 1-5). For more information on SNMP see “SNMP Management Reference” in Appendix E. For information on enabling SNMP agents, see “Enabling SNMP Agents” in this chapter.

The NetVisualyzer tools Analyzer, Browser, NetCollect, NetGraph, NetLook, NetSnoop, and NetTop generate events if the ToolTalk™ message facility is installed and operating. These events are sent to the NetVisualyzer event server nveventd(1M). nveventd processes the events and places them in an event log. By default, the event log is the file /usr/lib/netvis/eventlog.
NetVisualyzer tools automatically start nveventd if it is not already running when it is needed for event handling. Once started, it runs until it has no more clients and its idle timer has expired.
The events generated by the tools are listed below. Unless otherwise noted, they are generated by Analyzer, Browser, NetCollect, NetGraph, NetLook, NetSnoop, and NetTop.
| LOGGING BEGIN |
| |
| NEW NET | NetLook detected traffic from a previously unknown network segment (NetLook only, configured off by default). | |
| NEW NODE | NetLook detected traffic from a previously unknown node (NetLook only, configured off by default). | |
| RATE HIGH ALARM |
| |
| RATE HI CLEARED |
| |
| RATE LO ALARM |
| |
| RATE LO CLEARED |
| |
| SHUTDOWN | The tool is exiting. | |
| START SNOOP |
| |
| STARTUP | The tool is starting up. | |
| STOP SNOOP |
|
Event log entries include a timestamp, the event type, the name of the application that generated the event and its process id, the user's login name and user id, the alarm level for the event, the interface and filter being used for snooping, and other event specific information. Some sample entries are:
Sep 17 11:52:34 RATE LO ALARM NetGraph[11317] probins(3138) MINOR () total 1 packets/sec threshold: 10 Sep 17 11:52:36 RATE LO CLEARED NetGraph[11317] probins(3138) INFO () total 73 packets/sec threshold: 10 Sep 17 11:53:47 STARTUP NetGraph[11387] probins(3138) INFO () Sep 17 11:53:49 START SNOOP NetGraph[11387] probins(3138) INFO bubba.wpd.sgi.com(192.26.75.178) |
See the nveventd(1M) manual page for additional details.
To install and prepare to use NetVisualyzer, you must perform these tasks:
Install NetVisualyzer Display Station software on workstations that you want to be Display Stations and NetVisualyzer Data Station software on workstations that you want to be Data Stations (see “Installing NetVisualyzer Software”).
Enable snooping on Data Stations (see “Enabling Network Snooping”).
Enable the SNMP agent on each node that you want to obtain information from using Browser (see “Enabling SNMP Agents”).
Provide authorization for NetVisualyzer users in /usr/etc/rpc.snoopd.auth on Data Stations (see “Authorizing NetVisualyzer Users for Snooping”).
Provide authorization for NetVisualyzer users in /usr/etc/snmpd.auth on Silicon Graphics workstations that you want to obtain information from using Browser (see “Authorizing Browsing”).
Create /etc/passwd entries for NetVisualyzer users on Data Stations (see “Creating Password File Entries”).
Bring the /etc/hosts file up to date on the Data and Display Stations if necessary (see “Updating /etc/hosts”).
Configure event logging on Display Stations if the default event logging is not suitable (see “Configuring Event Logging”).
Initialize NetVisualyzer network licensing on Display Stations (see “Setting Up Network Licensing”).
These tasks are explained in the following sections. Most of these tasks need to be done just once—when you install NetVisualyzer software. You may need to perform the authorization tasks again at a later time to authorize additional NetVisualyzer users or reconfigure event logging.
The Display and Data Stations use TCP/IP as the standard networking protocol. If you are installing NetVisualyzer and setting up stations on a DECnet network, you need to do a few additional preparation tasks. For details, see Chapter 11, “Using NetVisualyzer in a DECnet Environment.”
Become superuser (root) and use inst(1M) to install NetVisualyzer software from IRIX.
NetVisualyzer software has been structured so that most files are installed in /usr/NetVis and /usr/ToolTalk. The exceptions are the configuration files /usr/etc/rpc.snoopd.auth and /usr/lib/netvis/eventcfgrc, and manual pages that are installed in their usual locations. When you install the links subsystems, symbolic links are created to link the files in /usr/NetVis and /usr/ToolTalk to familiar locations such as /usr/sbin. This makes several configurations possible:
To install software on your workstation, install the subsystems you want, such as netvis_data.man.data, netvis_data.man.relnotes, and netvis_data.sw.data, and also install the corresponding links subsystem (netvis_data.sw.links in this example).
To use NetVisualyzer software that you have NFS-mounted from another workstation, install the non-links software on the remote workstation, NFS-mount it at /usr/NetVis, and then install the links subsystem on your workstation.
No matter which configuration you choose, the links subsystem for each product you use must be installed on your workstation.
NetVisualyzer uses software that is provided in the subsystems eoe2.sw.ipgate, eoe2.sw.netman, and eoe2.sw.tcp. To check to see if these subsystems are installed on your workstation, give this command:
versions eoe2.sw.ipgate eoe2.sw.netman eoe2.sw.tcp |
Each subsystem should be listed in the output. If not, use inst(1M) to install them from your system software tapes or CD.
Additional information on installing NetVisualyzer software is provided in the NetVisualyzer Release Notes. For more information on using the installation program inst(1M), see the IRIS Software Installation Guide.
For information on installing NetVisualyzer Data Station software on Sun Microsystems workstations, see the NetVisualyzer Data Station Release Notes for Sun Systems.
As Figure 1-2 shows, the snoopd daemon and IRIX listen to every packet of information on the network. For each Data Station on the network on which you want to snoop (including your own), you must turn on snoopd. To turn it on:
Find out if you are using network information service (NIS) by giving this command:
/etc/chkconfig
If the output you get contains yp off, you are not using NIS and you can skip to step 4.
Check for snoopd by giving this command:
ypmatch 391000 rpc
If you get this output:
sgi_snoopd 391000 snoopd snoop
your NIS master is a Silicon Graphics workstation and you can skip to step 4.
Since, you are using NIS, but your NIS master is not a Silicon Graphics workstation, you must add the following line to the file /etc/rpc on your NIS master:
sgi_snoopd 391000 snoopd snoop
Restart the inetd(1M) daemon by giving this command on your workstation:
/etc/killall -HUP inetd
Restarting inetd after installing NetVisualyzer software causes the snoopd daemon to start when a NetVisualyzer tool sends a service request.
For more information, see snoopd(1M), inetd(1M), and rpc(4). For information on NIS, see the NIS Administration Guide.
Browser must communicate with the SNMP agent on each node you wish to browse. SNMP agents and the procedures for enabling them are vendor-specific. The procedure for enabling the SNMP agent on Silicon Graphics workstations is described below. For other types of nodes, contact the system administrator for that node for help in enabling SNMP on that node.
The Silicon Graphics SNMP agent is snmpd(1M). The SNMP agent software is contained in the subsystem eoe2.sw.netman. To configure a workstation so that snmpd is started automatically when the system is rebooted, give this command as root:
chkconfig snmpd on |
To check to see if the daemon is already running, give this command:
ps -e | grep snmpd |
If there is no output from this command, snmpd is not running. Give this command as root to start snmpd:
snmpd |
If you want to snoop on a Data Station, you must have authorization in the file /usr/etc/rpc.snoopd.auth on that Data Station. You must be superuser (root) to read or write /usr/etc/rpc.snoopd.auth. For security reasons, the owner and permissions of this file should not be changed.
A simple authorization line in /usr/etc/rpc.snoopd.auth has the form:
accept localhost:user |
This line authorizes the user user to use all snoopd services on this Data Station when he or she starts NetVisualyzer tools from this Data Station. user can be a login name, a numerical user id, or an asterisk (*), which stands for all users. To use localhost in /usr/etc/rpc.snoopd.auth, localhost must be defined in /etc/hosts.
Another simple authorization line is:
accept * |
This line authorizes all users from all hosts.
By default, /usr/etc/rpc.snoopd.auth contains this authorization line:
accept localhost:root.sys |
This line authorizes the user root with group sys to snoop locally on this Data Station.
“/usr/etc/rpc.snoopd.auth” in Appendix B contains additional information about the syntax of /usr/etc/rpc.snoopd.auth and the types of authorizations and restrictions you can specify in this file.
No special authorization other than a valid community string is required to browse on nodes other than Silicon Graphics workstations. (See “Browser Main Window” in Chapter 9 and “SNMP Management Reference” in Appendix E for more information about community strings.)
If you want to get and set MIB variables on a Silicon Graphics workstation using Browser, you must do several setup steps in addition to providing a valid community string while using Browser: confirm that the workstation you are browsing has SNMP agent software running, start it if necessary (see “Enabling SNMP Agents” in this chapter), and authorize your Display Station to browse on that workstation.
To be authorized to browse a Silicon Graphics workstation, the Display Station's host name must be specified in the file /usr/etc/snmpd.auth on the workstation you are browsing. You must be superuser (root) to read or write /usr/etc/snmpd.auth. For security reasons, the owner and permissions of this file should not be changed.
As an example, suppose that you want to browse a Silicon Graphics workstation named tahoe. Your workstation's name is sequoia. First, confirm that snmpd is running on tahoe:
rsh guest@tahoe 'ps -e | grep snmpd' |
Assuming that it is running, log onto tahoe as superuser and add this line to /usr/etc/snmpd.auth:
accept sequoia:* |
This line authorizes anyone using your workstation to browse the workstation tahoe when they give any community string. These users can perform both get and set operations.
By default, /usr/etc/snmpd.auth contains this authorization line:
accept *:public/get |
This line authorizes any user from any host who provides the community public to get variable values for this workstation.
See the snmpd(1M) manual page and the file for more information about the syntax used in this file.
In most cases, if you want to access NetVisualyzer tools on a Data Station, you must have an entry in the file /etc/passwd on that Data Station. If your login name does not appear in /usr/etc/rpc.snoopd.auth (if the file includes the line accept *, for example) you do not need to have an entry in /etc/passwd.
See passwd(4) and the Personal System Administration Guide for information on creating /etc/passwd entries.
NetVisualyzer tools use the information in /etc/hosts, among other methods, to convert node names to IP addresses. It is important that the information in this file be accurate. Your system administrator can provide you with instructions on updating this file.
Your /etc/hosts file must include a definition for localhost in order for you to use this name as a pseudonym for your workstation's name in /usr/etc/rpc.snoopd.auth (see “Authorizing NetVisualyzer Users for Snooping” in this chapter).
When ToolTalk software is installed and operating, NetVisualyzer tools automatically log events as described in “Event Logging” in this chapter. You can configure event logging so that it does not send certain types of events, so that it has non-default values for alarm events, and to specify the number, size, and name of event log files. If you do not install ToolTalk, all NetVisualyzer tools operate normally, but there will be no event logging.
Install ToolTalk, configure it, and start it by following these steps:
From the NetVisualyzer software distribution, install ToolTalk.sw.runtime and ToolTalk.sw.links. You can optionally install ToolTalk.man.manpages. If this installation is done at the same time as NetVisualyzer software installation, and you do not need to customize event logging, skip the remaining steps in this section. ToolTalk is started automatically in this case.
To customize event logging, edit the file /usr/lib/netvis/eventcfgrc. See the comments in this file and the nveventd(1M) manual page for details on how to modify this file.
If ToolTalk was installed after NetVisualyzer, give these commands as root to start ToolTalk:
cd /usr/lib/netvis
/usr/sbin/tt_type_comp -d system nveventd_types
killall -USR2 ttsession
If you modified /usr/lib/netvis/eventcfgrc, give this command to stop nveventd:
killall nveventd
nveventd is restarted automatically using the new configuration file by NetVisualyzer tools.
NetVisualyzer Display Station software is licensed to run on a single workstation only. Each Display Station is licensed to snoop on a limited number of Data Stations simultaneously. For example, say that your Display Station is licensed to snoop on five Data Stations. Using NetLook, you snoop on five different Data Stations. While you are snooping on NetLook, you can start NetTop, but you must use one of the Data Stations already used by NetLook because you are already snooping on five Data Stations. Snooping on two interfaces of a single Data Station counts as two Data Stations.
To initialize the license server for a Display Station, you must obtain a password string from Silicon Graphics. This password string licenses your Display Station to snoop on a specific number of Data Stations. Licensing information included with the NetVisualyzer Display Station software gives complete information for obtaining a password from Silicon Graphics. The general procedure is:
Start the NetVisualyzer license command, nvlicense(1M), by entering this command as root:
nvlicense
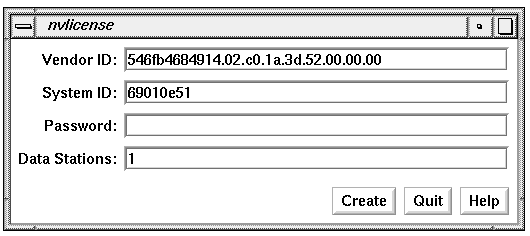
The window shown in Figure 1-6 appears.
Contact Silicon Graphic as instructed in the Network Licensing information sheet included with NetVisualyzer.
Report the string in the System ID entry field to Silicon Graphics, and confirm the number of Data Stations that your Display Station will be licensed to use.
Exit nvlicense by clicking the Quit button. After some period of time, a password will be generated and sent to you.
When you receive the password, start nvlicense again as root:
nvlicense
In the Password entry field, enter the password string supplied by Silicon Graphics.
In the Data Stations entry field, enter the number of Data Stations from step 3. You must enter exactly the number of Data Stations that was used to create your password string.
Click the Create button to create the license.
Click the Quit button to exit nvlicense.
This procedure enables you to use all Display Station tools (Data Station tools are not licensed).
If you have been given a password that has an expiration date encoded in it, license expiration warning messages appear when you start some NetVisualyzer tools within 30 days of expiration. Contact Silicon Graphics to obtain a new password.
The netvis(1M) command provides a convenient way to start NetVisualyzer tools, to bring up the NetVisualyzer tutorial, and to view NetVisualyzer manual pages.

If you are using WorkSpace, the netvis icon, shown in Figure 1-7, is automatically displayed.
When you click the netvis icon, the netvis directory view window shown in Figure 1-8 appears.
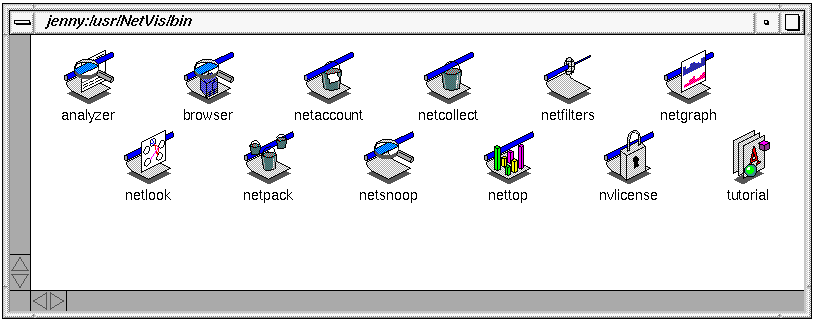
If you are not using WorkSpace, give this command to display the netvis directory view in Figure 1-8:
netvis |
| Note: Under certain conditions, some tools require that you be superuser (root) to run them. When this is the case, you must start WorkSpace as root or give the netvis command as root when you want to invoke these tools from the netvis directory view. |
The following sections describe how to use the netvis directory view to start tools, bring up the tutorial, and view manual pages.
To start any NetVisualyzer tool without specifying command-line options, double-click the icon for that tool (or click once and select “Open” from the WorkSpace pop-up menu). For example, to start NetLook, double-click the left mouse button on the netlook icon.
There are three methods for starting NetVisualyzer tools with options:
double-clicking the tool icon with the <Alt> key pressed (“ <Alt> Open”)
double-clicking a data file for the tool (“Open Data File”)
selecting one or more data files and dropping them on the tool icon (“Drop Data File”)
Each of these methods is described in a following section. Not all of these methods work with each tool; Table 1-1 lists the methods, whether or not they can be used, and data files that are applicable to each tool.
Table 1-1. Starting NetVisualyzer Tools with Arguments
Tool | <Alt> Open? | Open Data File? | Drop Data File? |
|---|---|---|---|
Analyzer | yes | yes, packet_file (from Analyzer or NetSnoop) | yes, .analyzerrc |
Browser | yes | no | no |
NetAccount | yes | yes, traffic_file (from NetCollect or NetPack) | yes, traffic_file (from NetCollect or NetPack) |
NetCollect | yes | no | no |
NetFilters | yes | yes, filter_file | yes, filter_file |
NetGraph | yes | yes, history_file (from NetGraph) | yes, .netgraphrc |
NetLook | yes | yes, network.data | yes, .netlookrc |
NetPack | yes | no | yes, traffic_files (from NetCollect) |
NetSnoop | yes | no | no |
NetTop | yes | no | yes, .nettoprc |
When you use this method, a window appears in which you can type options and arguments. The steps are:
Select the icon that represents the command you want to execute by pressing and holding the <Alt> key and then double-clicking the left mouse button on the icon. A Launch Command window, such as the one shown in Figure 1-9, appears.
Complete the NetVisualyzer command (the command can include options, a filter expression, and other arguments).
Press the Accept button (or press <Enter>) to execute the command and start the tool.

Open a data file that you want to use as an argument to a NetVisualyzer tool. Simply double-click the file and it automatically becomes an argument to the tool. Table 1-1 lists the tools and data files that use this method.
Select the data files that you want to use as arguments to a NetVisualyzer tool and drag them to the NetVisualyzer tool icon.
Click on a data file you want to use.
If you want to give additional data files as arguments, press and hold a <Shift> key while clicking on the additional data files.
Press the left mouse button on one of the data files.
Drag the cursor to the icon for the tool you want to use.
Release the left mouse button.
An online tutorial for NetVisualyzer is included in the subsystem netvis_display.man.tutorial. Designed for people who have not used NetVisualyzer before, it provides lessons on the basic operation of many of the NetVisualyzer tools.
To view the tutorial, double-click the tutorial icon in the netvis directory view.
You can view NetVisualyzer manual (man) pages easily using the netvis directory view. To display a NetVisualyzer man page:
Select the icon for the NetVisualyzer tool that interests you by clicking the left mouse button once on the icon. For example, if you want to see the Analyzer manual page, click the analyzer icon.
Display the Directory View pop-up menu by pressing and holding the right mouse button. Select “Manual page” from the menu.
A new window appears containing the manual page you requested. The top of the window shows the name of the page you are viewing. You can manipulate this window in the same way you manipulate any window; for example, you can close it by double-clicking the Window menu button.
The NetVisualyzer Display Station software product includes sample scripts that you may wish to use with NetVisualyzer tools. The directory /usr/people/4Dgifts/examples/netvis contains these sample scripts. Refer to /usr/people/4Dgifts/examples/netvis/README for a description of the contents of this directory.
Resource files for Analyzer, Browser, NetFilters, NetGraph, NetLook, and NetTop are included with Display Station software. They are installed in /usr/lib/X11/app-defaults. The resources for each tool are listed in the tool's manual page in Appendix F, “NetVisualyzer Manual Pages.”