The Map Visualizer shows data displayed over a three-dimensional landscape of bar chart shapes or recognizable geographic shapes. It is useful when your data has a geographical context or some specific topographical layout. This section covers the following topics:
Sample configuration and data files have been provided to demonstrate the Map Visualizer's features and capabilities. These files are in the MineSet\examples directory, in the location where MineSet was initially installed.
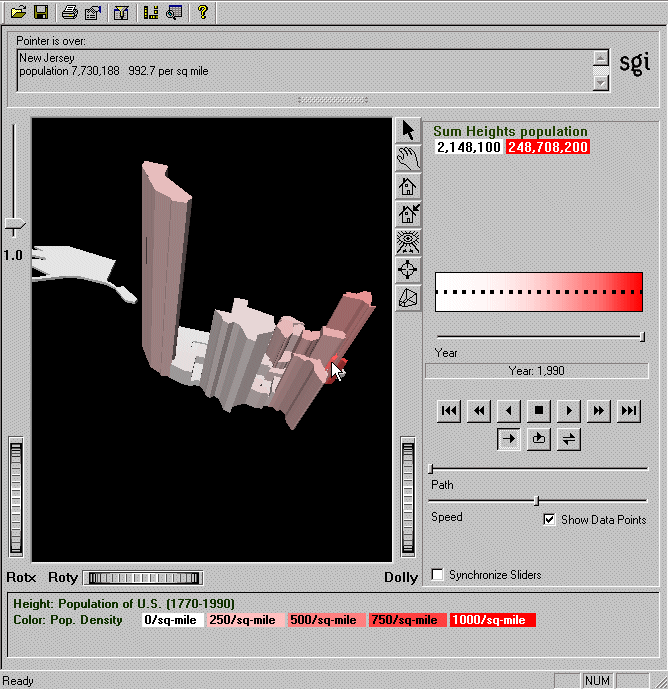
The Map Visualizer helps you look at spatially related data. Besides dynamically navigating through this geographically based landscape, you can drill up and down to get an overview or to see increased granularity, as well as use animation to see how the data changes across one or two independent dimensions. An independent dimension is any attribute such as age or year, that can vary independently of another column. The animation panel to the right of the main window appears only when the dataset contains independent dimensions mapped to sliders (as shown in Figure 6-1.)
The landscape can also consist of a flat plane of geographical objects drawn as simple outlines, with “bar chart” cylinders placed at specific locations (see Figure 6-2).

Another landscape possibility is lines with endpoints at specific locations, each line showing an individual width and color (see Figure 6-3). The individuality of these lines corresponds to height and color properties of the usual objects and cylinders.

This is the most common way to start the Map Visualizer:
Bring up the Tool Manager, and select a server and data source. Refer to Chapter 2, “Accessing Data with MineSet,” if you need help. Use the churn dataset for this example.
In the Tool Manager Data Destinations pane, click the Viz Tools tab; from the lower row of tabs, click Map Visualizer.
If you have the Viz Tool icon on your desktop, you can drag an existing MineSet visualization file icon and drop it on the Viz Tool icon. The visualization will then display in the Viz window.
You can also drag a visualization file into an open Viz Tool window. If you have your preferences set to Single Document mode, you must drop the file icon onto the title bar of the Viz window. If you have your preferences set to Multiple Document mode, you can drop the file icon anywhere within the window, and it will display.
This sections walks you through the steps of transforming geographic data so that it can be displayed by the Map Visualizer.
You must now transform the data into a smaller dataset before distributing it across the geographical map. Such a transformation is called aggregation.
In the Tool Manager Data Transformations pane, click Aggregate.
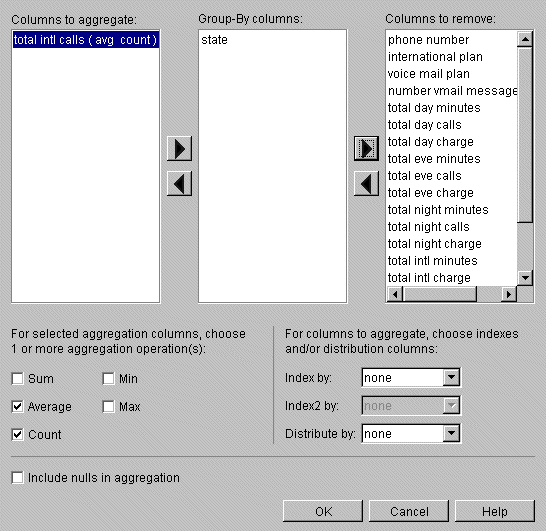
Move the column of interest to the “Columns to aggregate” list, and identify the mathematical action using the bottom check boxes. Leave the spatial grouping in the central “Group-By columns” field, and remove all other columns from the visualization. See Figure 3-5 for an explanation of the action.
For example, using the churn dataset, in the Aggregate dialog box, move total intl calls into the left list by clicking on the column, then the left-pointing arrow. Check Average and Count on, and turn off Sum. Leave state in the central list and move all the rest to the right list. (Hold down the Ctrl key to gather multiple columns.) Click OK to apply your choices.
The next step is to find the appropriate spatial shapes.
Click the Tool Options button on the Viz Tools tab of the Data Destinations pane to access the geographic files. Tool Manager displays the Map Visualizer Options dialog box.
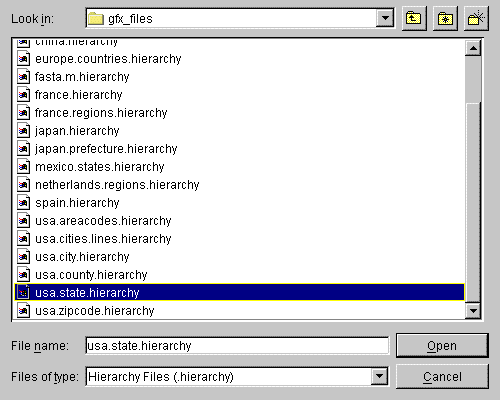
Click the button to the right of the Entities text field and select one of the geographic entities files. These files are in the location where MineSet was initially installed, under MineSet\config\mapviz\gfx_files. This example uses usa.state.hierarchy.
Click OK to retrieve the selected file and OK again to dismiss the Map Visualizer Options panel. For more details about .gfx files, see the “Map Visualizer” entry in the MineSet Enterprise Edition Reference Guide .
The next step is to link the visual elements to the columns.
When linking the map elements to visual entities, some columns may require manipulation before they fit the visual elements criteria:
If the column offers too many discrete values, see “Changing or Creating New Bins for Columns” in Chapter 3.
If the column is the incorrect type, see “Changing a Column Type or Name” in Chapter 3.
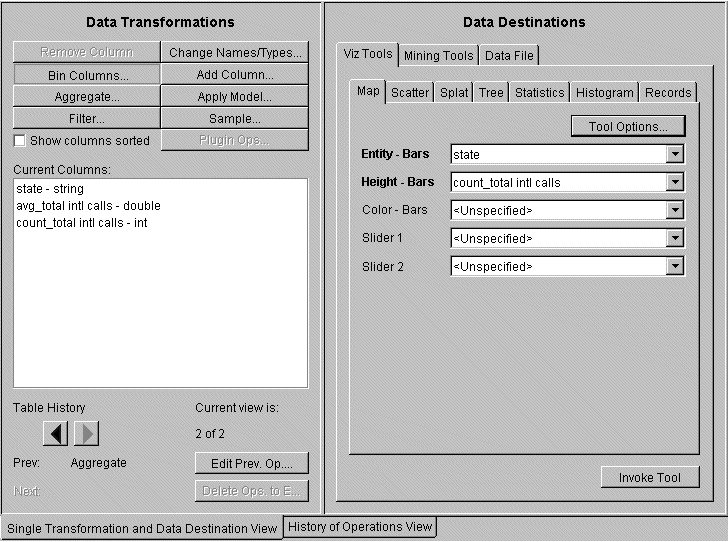
From the Tool Manager Data Transformations pane, map the columns to entities in the Data Destinations pane. Map items by making a choice from the popup menus next to each entity.
For this example, for Entity-Bars choose state, and for Height-Bars choose count_total intl calls.
For further mapping possibilities see “Mapping to Sliders” and “Mapping to Maps.”
Click Invoke Tool to view the geographic distribution of your dataset.
When you suspect a value changes according to a specific criteria, such as income varying by age, you can map a column to a slider when you are mapping other columns to other visual elements. For example, Figure 6-1 has a slider mapped to the column Year. This allows you to show how the data varies year by year by moving the slider.
Columns can be mapped to sliders if that column is numeric (of the type int, float, double) or binned. If the column is already binned it has a _bin suffix. Column type is noted after the name of the column in the Current Columns field, for example total day calls - double.
Sliders can be created automatically or manually. The Tool Manager automatically generates sliders when you map columns to them. Sliders are created through a combination of automatic binning and aggregation. See the glossary entries: Binning and Aggregation. These automatic operations occur after clicking Invoke Tool.
Whenever the current data table has an array column, the Tool Manager can create a slider corresponding to the indices of the array column. The current slider indices are indicated in the Tool Options dialog box. To display them, from the Tool Manager Data Destination pane, click the Viz Tools tab, then click the Tool Options button. All array columns in the current table must have the same indices; otherwise, no slider is created.
See “Creating New Columns by Aggregation” in Chapter 3 and the “Aggregate” entry in the MineSet Enterprise Edition Reference Guide for more information on creating arrayed columns.
For details of automatic and manual sliders, see the “Slider Creation for Mapviz, Scatterviz, Splatviz” entry in the MineSet Enterprise Edition Reference Guide .
MineSet supplies a variety of .gfx and .hierarchy files consisting of recognizable geographic shapes and other spatial entities. Unless you map Entity-Bars to a graphic element, you will not get a recognizable map.
If you want to show another visual entity or geographical map, replace “Choosing the Map Shapes” with these steps:
From Tool Manager Viz Tools tab, click the Tool Options button.
Choose the options you want from the dialog box. The MapViz Options dialog box appears as shown in Figure 6-6.
For map-shaped entities, click the Find File button to the right of the Entities File text field and select one of the .hierarchy geographic entities files to be used for the representation of objects in the Map Visualizer's main window. These can be found in /config/mapviz/gfx_files.
For rectangles click the Find File button to the right of the Outlines File text field to specify outline objects to draw. These appear as a flat plane on which the 3D entity objects are placed.
Specifying Entities File and Outlines File fields are optional. If the Entities File is not supplied, you see entity objects consisting of rectangles that are arbitrarily arranged in the scene.
For description of other options, see the “Map Visualizer” entry in the MineSet Enterprise Edition Reference Guide .
Once you have finished making changes to the Tool Options dialog box, click OK to return the Tool Manager's main screen. You can then click Invoke Tool.
As with any of the visualizers, if you started the Map Visualizer without specifying a configuration file, perhaps using the Visual Tools pulldown menu from the Tool Manager, the main window appears empty, and only the File, View, and Help pulldown menus can be used. To show all menus and controls, use File > Open to see a list of configuration files. These files are in the MineSet \examples directory, in the location where MineSet was initially installed.
When you have specified a valid configuration file, its geographical landscape is visible. For example, Figure 6-7 shows the results of specifying population.usa.mapviz and moving the Year slider to the far right.
This shows the population and population density for each state of the United States. The population of each state is represented by the height of the state's graphical shape. Heights are relative to one another across the entire range of the animation controls, which are in the area to the right of the main window.
The two modes of viewing are grasp and select. To toggle between these modes, move the cursor into the main window, and press the Esc key. You can also change from one mode to the other by clicking on either the arrow or the hand on the window border. For more details see page 68.
You can drill down in select mode to get finer detail, or drill up to see a more general view only if the .data and .hierarchy files support drilling down and up. The Map Visualizer sample files support drilling down and up.
Table 6-1. Drilling Techniques
To: | Do this: |
|---|---|
Drill down on object | Click the right mouse button over the object. |
Drill down on all objects | Click the right mouse button over the background. |
Drill up on object | Hold the Ctrl key and click the right mouse button (or click the middle mouse button) over the object. |
Drill up on all objects | Hold the Ctrl key and click the right mouse button (or click the middle mouse button) over the background. |
You can repeat drilling down to the finest level of granularity supported by the data. The greater the number of objects, the longer the Map Visualizer takes to reconstruct the scene after a drilling operation, and the slower the performance when moving the animation controls.
By default, the Map Visualizer initially displays objects at the greatest level of detail, so that, initially, only drill-up (to coarser granularity) is active.
You can create an animation using the animation control panel to the right of the main window. The animation window appears only if the dataset has one or two sliders mapped. See the “Animation” entry in the MineSet Enterprise Edition Reference Guide .
You can access additional Map Visualizer functions using the pulldown menus View and Selections.
The View menu gives you the options summarized in Table 6-2. For greater detail, refer to the View menu entry in the MineSet Enterprise Edition Reference Guide .
Table 6-2. View Menu Choices for Map Visualizer
Option | Description |
|---|---|
Filter Panel | Brings up the Filter Panel to filter the number of entities displayed in the main window based on selected criteria. See the Filter entry in the MineSet Enterprise Edition Reference Guide. |
Window Decoration | Shows or hides external controls around the main window. |
Animation Panel | Shows or hides any animation control panel to the right of the main window. |
Data Points | Causes a grid of black dots indicating precise data values to appear or disappear in the 2D summary window. |
Use Random Colors | Activates or deactivates the configuration file's color mapping specifications. |
Display X-Y Coordinates | Used for developing and refining .gfx files, not for data analysis. For details see the Map Visualizer entry in the MineSet Enterprise Edition Reference Guide. |
The Selections menu lets you perform the actions outlined in Table 6-3 on your selected data in Map Visualizer. For further details see the “Map Visualizer” entry in the .
Table 6-3. Selections Menu Choices for the Map Visualizer
Option | Description |
|---|---|
Show Values | Displays a Record Viewer table of values for the selected objects. |
Drill Through | Opens the Drill Through Dialog, which gives you the option to view the selected data in the Record Viewer or send the data to the Tool Manager as a filter, a new column, or as SQL. You can send the records to a new copy of Tool Manager or you can send all non-selected records to the Tool Manager (complement drill through). |
Use Slider on Drill Through | Determines if the slider position is used in creating the drill-through expression. The default limits the drill-through to those records defined by the slider's position. |
For further details on drill-through, see the “Drill-Through” entry in the MineSet Enterprise Edition Reference Guide .
For a description of additional sample files for Map Visualizer, see the “Sample Files” entry in the MineSet Enterprise Edition Reference Guide .