This chapter describes how to start out with MineSet, and shows how to view your data using procedures from the graphical user interface called Tool Manager. The topics discussed are:
Also see the MineSet Enterprise Edition Tutorial to practice using the various tools. When you want to use data from your own database, refer to MineSet Enterprise Edition Interface Guide , “Setting Up MineSet.”
You can install MineSet from the CD or over the Internet. Once you have installed MineSet, usually on your own system, you can start using it immediately by practicing with the preformatted data files supplied with the MineSet release (found in the data directory in the directory where MineSet was installed. The next section contains a brief explanation of the operation of MineSet. If you want start immediately, see “Starting MineSet”.
MineSet works in a client/server manner, with the server process existing either on the same system as the client or on a different, usually more powerful, system. The server must be installed somewhere accessible to the client. The DataMover is a process that runs on the server, and is responsible for accessing database files, performing data transformations, running mining operations, and generating the visualization files. These visualization files are then transferred to the client.
The Tool Manager is a client process providing the graphical user interface (GUI) in which you do most of your interactions with MineSet. These interactions compose the bulk of this chapter. You use Tool Manager to specify the source of your data, the set of transformations to be applied to the data, which mining and visualization tools to use, and how to save the results of your work.
Once these specifications are complete, you can direct MineSet to access the required data and perform the actions you specified through Tool Manager. Tool Manager then sends this information to the server DataMover process. If the data to be analyzed exists in a flat file, MineSet reads a configuration (.schema) file containing meta-information about the table and the name of a .data file where the real data is located. If the data to be analyzed is in an Oracle, Sybase, or Informix database, DataMover executes a query against the database to get the desired dataset.
The .schema file describes the format of an input data file. These files are explained in detail in the MineSet Enterprise Edition Interface Guide .
 | Note: Before using any of the MineSet tools, follow the installation and licensing instructions in the MineSet release notes. Your system administrator may need to set up the DataMover configuration file. The setup details are described in the MineSet Enterprise Edition Interface Guide . |
MineSet features an application programming interface (API) so that you can integrate MineSet's visualizers and data mining engines into your own applications. See the MineSet Enterprise Edition Interface Guide and the MineSet website for more information.
In order for the examples in this book to display properly, the color palette on your display must be set to True Color. To set this, choose Start > Settings > Control Panel. When the Control Panel directory displays, double-click on the Display icon. In the resulting dialog box, choose True Color from the Color Palette drop down menu.
The easiest way to start MineSet is to create a shortcut for mineset.exe on the desktop. To do this, from the directory in which MineSet is installed, go to the \bin directory and click the mineset.exe file. From the File menu choose Create Shortcut.
You can also reach MineSet from the desktop Start > Programs > MineSet Enterprise Edition menu. Either select with the left mouse button to launch it, or press and hold the right mouse button to drag to the desktop and release the right mouse button.
Click on the MineSet shortcut icon and the MineSet Tool Manager is displayed.
If the “Log in to Server” dialog box (Figure 2-1) does not come up by default, choose File > Connect to Server. In the resulting dialog box, click “This machine as current user,” if you wish to use your current system as both client and server. If you wish to use another system as a server, type in the server name, your login name, and your password (if any).
In the Tool Manager window, choose File > Open New Data File. In the Open Data File window that appears, enter the path to the data you plan to use. If you wish to experiment with some of the sample files shipped with MineSet, they are in the MineSet\data directory, in the location where MineSet was initially installed.
To work with a sample file, select churn.schema from the Open Data File window. This file is a sample table of data provided with MineSet. The entries shown in the right-hand Preview Columns pane are columns of data, as shown in Figure 2-2. Click OK.
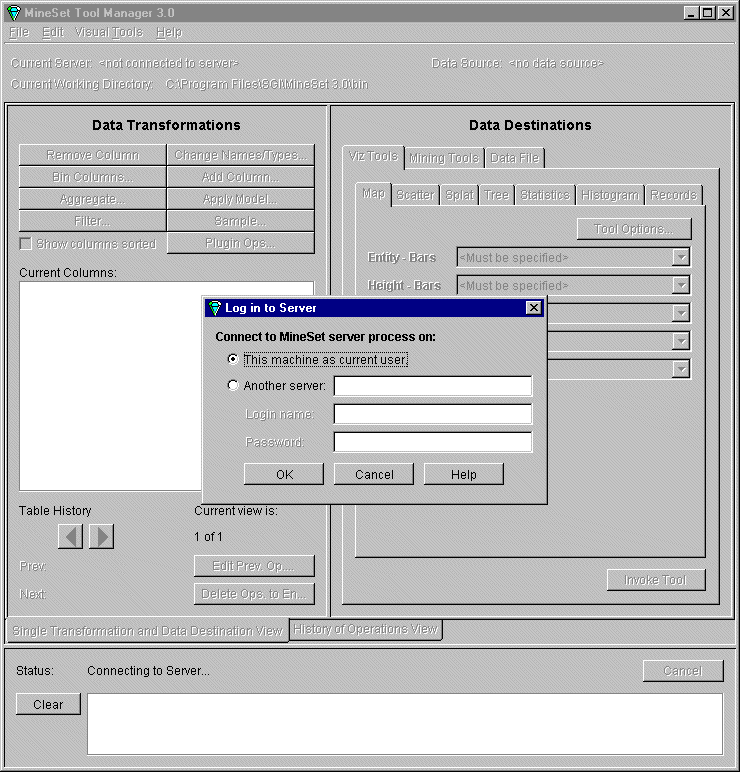
The churn.schema file gives you access to a dataset of telecommunications customers. The next time you run MineSet, you will be automatically returned to the state you were in when you last exited MineSet, and any option selections you made will be restored.
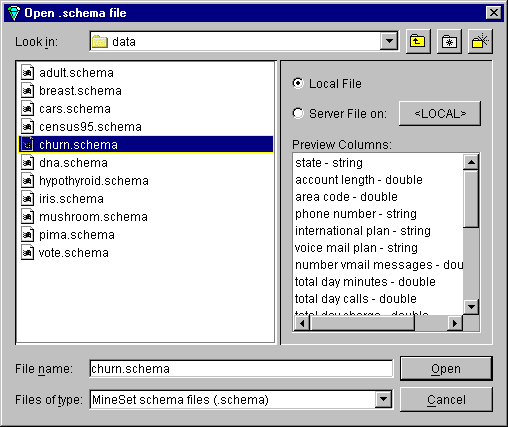
The MineSet Enterprise Edition Reference Guide contains a list of other sample files you can use to practice with; see the entry “Sample Configuration and Data Files” for the contents of each.
| Note: You can also run MineSet in batch mode. When running in batch mode, the Tool Manager performs the actions described in a session file without bringing up any visualizations. Batch mode can be particularly useful in projects requiring lengthy computations that need to be done frequently. For instance, the computations can be run at night so the data will be ready the next morning. |
The Tool Manager is your main point of entry to all actions, so it is helpful to make a quick tour of the parts.
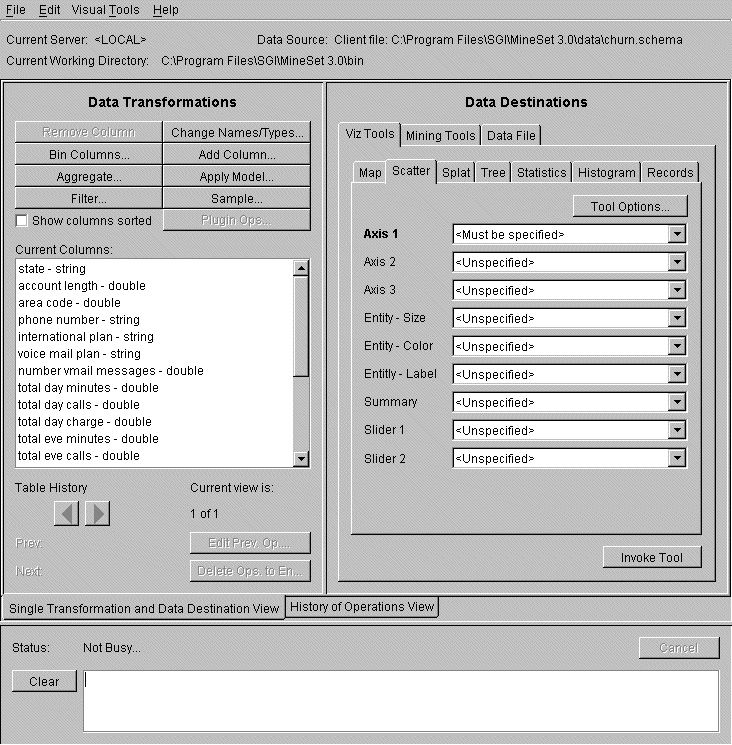
The Data Transformation pane on the left is where you transform all the data. The actions you take using the buttons at the top affect the Current Columns listed beneath. The buttons below allow you to go forward and back in the history of your transformations; the Status window across the bottom shows the action currently taking place on the dataset. The Data Destination pane on the right allows you to choose between Visualization Tools and Mining Tools or to save your current state to a Data File. Each of these functions is covered in later sections.
An easy way to become familiar with your selected dataset is to use the Record Viewer to see the database records and the data values within the columns. The records appear in spreadsheet form.
Bring up the Tool Manager as shown in “Starting MineSet”and follow these steps:
From the Tool Manager Data Destinations pane, click the Viz Tools tab.
From the lower row of tabs, click Records to access the Record Viewer.
Click Invoke Tool in the lower right corner of the pane, and the Record Viewer appears (Figure 2-4).

If you prefer to see the results differently, the Record Viewer can make various sorting, renumbering, and resizing adjustments (see Table 2-1 below.)
You can change the appearance of the Record Viewer columns using the methods shown in Table 2-1:
Table 2-1. Manipulating Record View Columns
To: | Do This: |
|---|---|
Resize columns | Click on right column divider and drag in desired direction. |
Rearrange columns | Click and drag title cell to desired location. |
Hide columns | Choose Hide/Show columns from View menu, deselect columns to hide. |
Sort record order by column values | Click on column title cell. |
Sort record order by multiple columns | Hold down the Control key and click on each column title that you wish to sort by, in the order in which you wish them to sort. |
Reverse the sort | Click column title cell again. |
Return to original order | Click the row # column title. |
Renumber rows | Choose Renumber rows from the View menu (cannot undo this function). |
Search for a number or value | Choose Search panel from View pulldown menu, enter a value in the Find field, highlight the columns you want to search in, click Find Next or Find Previous. To select multiple columns, use Shift-click; for noncontiguous columns, use Ctrl-click. |
You can filter data so that you see only a certain range of values.
From the Record Viewer window, choose View > Filter Panel.
Select a column and expression from which to build a filtering expression. For example, in the cars dataset, you build the expression `cubicinches' > 400 to filter those records with cubic-inch capacity greater than 400 ci. (See Figure 2-5).
You can build the expression by selecting elements on the left and clicking the right-pointing arrow; or you can simply type directly in the text field.
Click Apply and the filtering starts at once. The panel remains up until you dismiss it.
To remove the filtering, clear the expression in the expression window and click Apply or choose View > Remove Filter from the Record Viewer window.
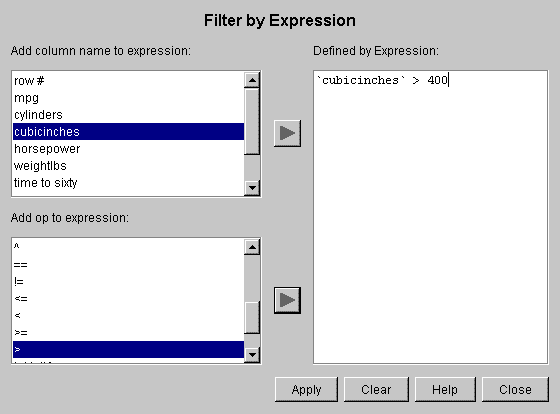
You may have as many filter panels open as you wish. To apply more than one filter at a time, first apply one, renumber the rows, then apply the next.
| Note: Renumbering the rows cannot be undone. To return to your original data, you must reopen the file. |
You can save your file in Record Viewer, using either File > Save or File > Save As.
With Save As, you can save your data in four formats: binary, ASCII, HTML, or text. When you save in binary or ASCII format, both the data file (the table) and a schema file (describing the contents of the data file to Tool Manager and Data Mover) are saved. HTML format saves the file as an HTML table. Text format saves the file in tab-delimited form, with the column titles as the first row.
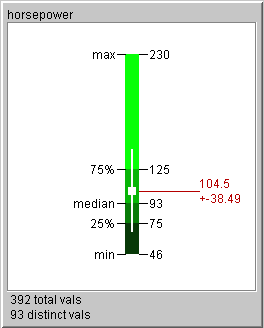
You can find out more about the records in the dataset with the Statistics Visualizer. Certain statistics are calculated, based on the number of records in the dataset. Depending on whether the type of data in the column is numeric or discrete, statistics are shown as box plots and histograms, respectively.
The box plots show the minimum, maximum, mean, median, and two quartiles (25th and 75th percentiles) of numeric values in a column, as lines across a vertical colored bar. The standard deviation of the dataset population is shown as a +/- value. The quartiles are shown whenever there are fewer than 50,000 distinct values (see Figure 2-6). If there are more than 50,000 distinct values in the column, the statistics are shown as a gray vertical bar. For definitions of the terms Mean, Median and Standard Deviation, refer to the glossary.
The histograms show results from columns of non-numeric data, such as string, or bin. (See Figure 2-7.) This means that the columns in the data table can contain strings such as “yes” or “spore_color,” or binned values such as “10-70.” There can be up to 100 distinct entries like this. The default ordering of the string-valued (nominal) attributes is by decreasing count, but you can use the View pulldown menu to choose an alternative sorting. The two ways of sorting strings are by count (or weight if weighting is selected), or alphabetically by name. If there are 100 or fewer distinct categories, the column panel also contains the count of distinct values. If the values are binned, the bin ordering is maintained regardless of the sorting method.
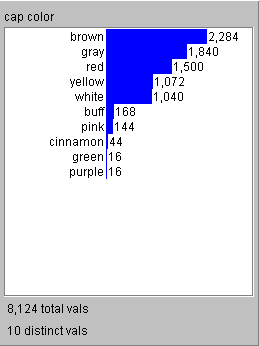
After creating a visualization of your data, you can see any truncated textual information in the histograms when you pass the mouse across a field without clicking.
The simplest way to start the Statistics Visualizer is to follow these steps, after you have selected a dataset:
From the Tool Manager Data Destinations pane, click the Viz Tools tab.
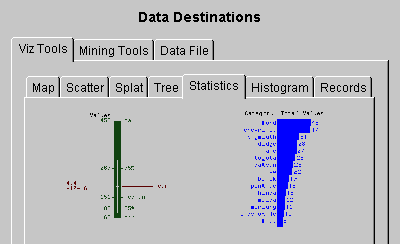
From the lower row of tabs, click the Statistics tab to access the Statistics Visualizer (Figure 2-8).
Click Invoke Tool in the lower right of the pane.
See the “Statistics Visualizer” entry in the MineSet Enterprise Edition Reference Guide for other methods of starting the tool.
You can work with some sample data files to familiarize yourself with the Statistics Visualizer's features and capabilities. These files are in the location where MineSet was initially installed in the MineSet directory, under \examples.
Start the Statistics Visualizer from the Visual Tools menu on Tool Manager's menu bar, then use the File > Open pulldown menu and open any .statviz file.
The Histogram Visualizer automatically bins all of the columns containing continuous, that is, numeric values and sends the result to the Statistics Visualizer for display. See the glossary entry for Binning.
The easiest way to start the Histogram Visualizer is to follow these steps:
From the Tool Manager Data Destinations pane, click the Viz Tools tab.
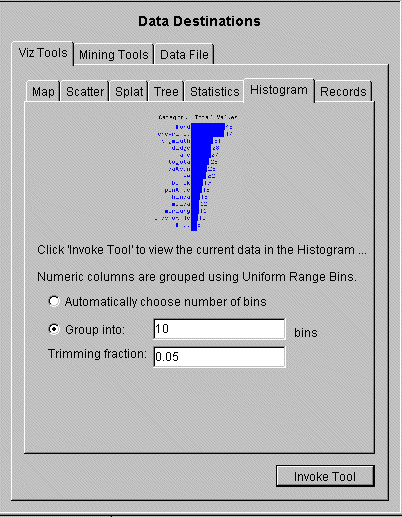
From the Tool choice menu, choose the Histogram Visualizer (Figure 2-9).
You can set the following options or simply go on to Step 4:
Pick the number of bins, or allow MineSet to do it for you.
Set the trimming fraction, which indicates the fraction of extreme values to be excluded before the bins are generated. The default is 0.05. This excludes the 5% of instances with most extreme values (2.5% at the lowest end and 2.5% at the highest). Trimming tends to reduce the influence of outliers on the generation of thresholds. Outliers are single instances that lie outside the bulk of the data.
Click Invoke Tool in the lower right of the pane.
The Status window at the bottom of the Tool Manager window shows the progress of the algorithm through the data. The current data is then displayed as histograms, from which you can gain a swift overview of where the data falls. See “Understanding Histograms”.
This section describes the navigation controls in the various MineSet visualizers. The tree visualizers have one set of controls, described in “Navigating in the Tree Visualizers,” below. The non-tree visualizers have another set of controls, described in “Navigating in Non-Tree Visualizers”.
The Tree Visualizer display is best thought of as though you are viewing the scene through a camera. To change the view, you change the position of the camera (the viewpoint). This section consists of two tables that serve as a quick reference for the Tree, Decision Tree, Option Tree, and Regression Tree Visualizer controls. Table 2-2 describes the navigation buttons.
Table 2-2. Navigation Icons in the Tree Visualizers
icon | Action |
|---|---|
 | Returns the chart to the size and position designated as the home view. By default this is the size and position of the chart when the visualizer is first invoked. You can change the home position by using the next icon. |
 | Sets a new home view for the chart. Use this to save a certain view or position. |
 | Moves the chart to a position where it is centered and all of it is visible in the window. |
 | Undoes the previous move (like the Back button on a Web browser). |
 | Redoes a move that has been undone (like the Forward button on a Web browser). |
 | Moves one node closer to root of tree. |
 | Moves one node or bar to left. |
 | Moves one node or bar to right. |
 | Moves one node down the tree on the left path. |
 | Moves one node down the tree on the right path. |
 | Pops up a menu of possible paths from the current node. |
Table 2-3 lists several manipulations you can perform on the scene in the Tree Visualizer. Most of these manipulations can be done either with one of the controls on the visualizer window or with a mouse action.
Table 2-3. Manipulating the Tree Visualizer Scene
Action | Slider or Wheel | Mouse Equivalent |
|---|---|---|
Fly over surface of the scene | N/A | Hold down left and right mouse buttons (or middle mouse button) and move mouse. |
Raise or lower bar heights to emphasize differences | Height slider (upper left) | N/A |
Move viewpoint up and down | H wheel | Hold down right mouse button, and move mouse up and down. |
Move the viewpoint from side-to-side | Side-to-side wheel (<-->) | Hold down left and right mouse buttons (or middle mouse button) and move mouse side to side. |
Move the viewpoint backwards and forwards | Dolly wheel | Hold down left and right mouse buttons (or middle mouse button) and move mouse up and down. |
Change the up and down tilt of the camera | Tilt wheel | N/A |
Move forward in direction you are pointing | N/A | Hold down Alt key and left and right mouse buttons (or middle mouse button) and move mouse. While moving forward, the viewpoint also moves down, based on the current tilt. Similarly, while moving backward, the viewpoint moves up, based on the tilt. |
Select a child of a node | N/A | Hold down Ctrl key and click right mouse button on parent node, then click on child to move there (or use branching navigation icon). |
This section consists of two tables that serve as a quick reference for the Evidence, Decision Table, Map, Scatter, and Splat Visualizer navigation controls. Table 2-4 describes the navigation buttons.
Table 2-4. Navigation Buttons in Non-Tree Visualizers
Button | Name | Action |
|---|---|---|
 | Pick | Changes the program to pick mode (an arrow). In pick mode (also called select mode), you can highlight (brush over) or select (click) elements of the chart. |
 | Grasp | Changes the program to grasp mode (a hand). In grasp mode, you can move the chart around in the window: — To move the chart in the window, hold down the right mouse button while moving the mouse. — To rotate the chart, hold down the left mouse button and move the mouse. —To dolly the chart in and out, hold down the left and right mouse buttons (or the middle mouse button) and move the mouse. |
| Home | Returns the chart to the size and position designated as the home view. By default this is the size and position of the chart when the visualizer is first invoked. You can change the home position by using the set home icon. |
| Set home | Sets a new home view for the chart. Use this when you want to save a certain view or position. |
| View All | Moves the chart to a position where it is centered and all of it is visible in the window. |
 | Zoom | Moves the point you select to the middle of the pane and zooms to it. When the mouse cursor becomes a targeting sight, move it to the spot you want to see more clearly, then click left mouse button. |
 | 3D | Toggles the 3D perspective. |
 | Top View | Changes the chart to a top view (Scatter and Splat Visualizers only). |
 | Front View | Changes the chart to a front view (Scatter and Splat Visualizers only). |
 | Side View | Changes the chart to a side view (Scatter and Splat Visualizers only). |
Table 2-5 describes the adjustment sliders and wheels in the non-tree visualizers.
Table 2-5. Manipulating the Non-Tree Visualizer Scene
Action | Slider or Wheel | Mouse or Keyboard Action |
|---|---|---|
Toggle between Select and Grasp mode | N/A | Press Esc key or the navigation buttons. |
Move the scene | N/A | In grasp mode, click and hold the right mouse button. Move the cursor in the direction you want to move the chart. |
Raise or lower cake, pie, or bar heights to emphasize differences | Height slider (upper left) | N/A |
Rotate the scene around X axis | Rotx wheel | In grasp mode, click and hold the left mouse button. Move cursor in the direction you want to rotate the chart. |
Rotate the scene around Y axis | Roty wheel | In grasp mode, click and hold the left mouse button. Move the cursor in the direction you want to rotate the chart. |
Zoom the scene in and out | Dolly wheel | In grasp mode, click and hold the left and right mouse buttons (or middle mouse button). Move the mouse down to zoom in and up to zoom out. |
Drill down through levels of detail (Decision Table and Map Visualizers only) | N/A | Put the mouse arrow over a specific chart (or the background for all charts) and click the right mouse button. |
Drill up through levels of detail (Decision Table and Map Visualizers only) | N/A | Put the mouse arrow over a specific chart (or the background for all charts) and Ctrl-click the right mouse button (or click the middle mouse button). |
Brushing is a feature that allows you to select the same data points in more than one visualization at a time. When you select something in a visualization that supports the sending of brushing events, it will also become selected in any other visualization that is currently open and that supports the receiving of brushing events. Scatter Visualizer and Evidence visualizer support both send and receive brushing events. Tree Visualizer, Map Visualizer and Decision Table Visualizer support only the sending of brushing events.
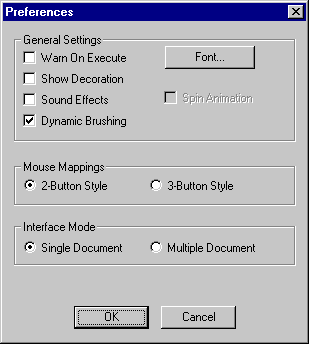
All of the Viz Tools allow you to view multiple documents in one window. A document can be a MineSet visualization, a Word document, or any other viewable file. Documents can be opened from the File menu, or dragged and dropped into the 3DVisualizer window. When a document that is not a MineSet visualization is displayed in the 3DVisualizer window, some menu items are disabled. By default, the 3DVisualizer window only allows one document at a time. To change to multiple documents:
Choose File > Preferences. The preferences Dialog box opens (Figure 2-10).
In the Preferences dialog box, check the Multiple Documents radio button.
| Note: This change will not take effect until the next time you open the Viz window. |
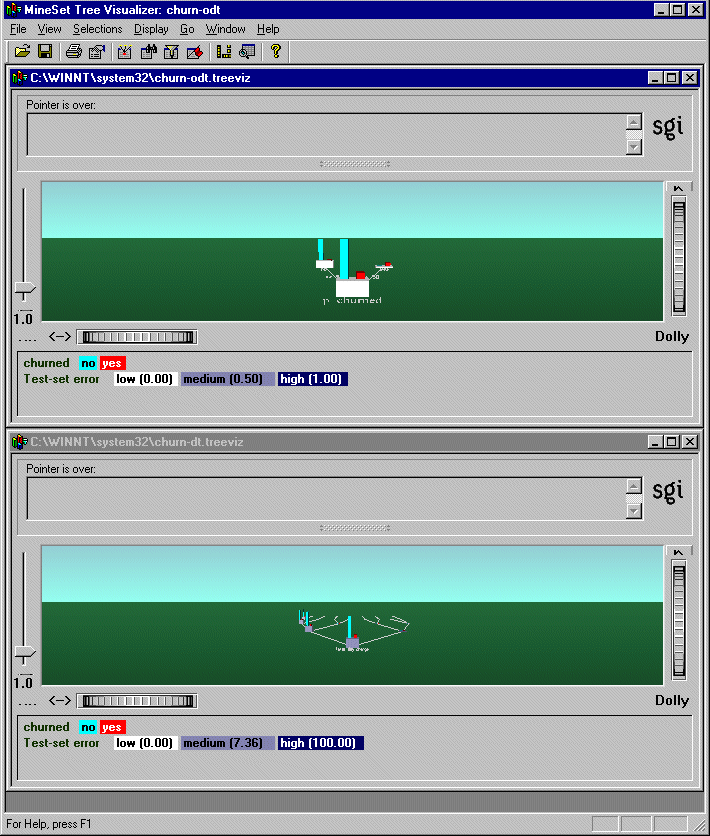
Figure 2-11 shows a 3D Visualizer window with both an Option Tree and a Decision Tree visualization.
Besides the sources listed in “Finding MineSet Information”, other sources of information about MineSet are:
MineSet Enterprise Edition Tutorial for a quick introduction to the use of the tools.
Context-sensitive help is available within each tool: press F1 over an area of interest.
Online demo movies give a quick overview of some of the tools from http://mineset.engr.sgi.com/movies.