This chapter contains the following sections:
Sample configuration and data files have been provided to demonstrate the Tree Visualizer's features and capabilities. These files are in the examples directory under MineSet, in the location where MineSet was initially installed.
The Tree Visualizer is a graphical interface that displays data as a three-dimensional landscape. It presents your data hierarchically in the form of a tree. Each level of the tree branches on the values of a different attribute. Each node in the tree shows a chart representing all the data in the subtree below it. The chart is composed of a base block with height and color depending on the data attributes. On each base are bars and/or disks whose number, label, height, and color are also determined by the attributes you have specified.
As shown in Figure 5-1, the Tree Visualizer displays quantitative and relational characteristics of your data by showing them as hierarchically connected nodes. Each node contains bars and disks whose height and color correspond to aggregations of data values (usually sums, averages, or counts). The lines connecting nodes, called edges, show the relationship of one set of data to its subsets.

This section describes how the Tree Visualizer can be configured using the Tool Manager. Although the Tool Manager greatly simplifies the task of configuring the Tree Visualizer, you can construct a configuration file manually using an editor. There are also several other ways to start the Tree Visualizer, see the MineSet Enterprise Edition Reference Guide for details.
To start the Tree Visualizer from the Tool Manager:
Choose File > Connect to Server and log into a server.
Choose File > Open New Data File and select or type in the desired filename.
In the Data Destination panel, click the Viz Tools tab (Figure 5-2).
From the tools tabs, choose the Tree Visualizer tab.
Map specific attributes from your dataset to the appropriate Visual Elements in the Data Destinations Pane using the pulldown menus beside the Visual Elements. See “Mapping the Tree Visualizer Visual Elements” for more information about mapping.
Click the Tool Options button and specify Height and Color Aggregations in the Tree Visualizer Configuration Options panel. This step can be crucial for getting a meaningful visualization.
By default, the height (or color) of the bars of the parent node represents the sum of the values of all the bars of the children; however, for some datasets, average, max, min, or count may be better choices. Aggregations can be specified for the heights and colors of bars, bases, and disks. See the MineSet Enterprise Edition Reference Guide for more details about aggregation and other, more advanced options.
Click Invoke Tool to start the visualizer.
The Status box at the bottom of the Tool Manager window shows the progress and resulting statistics.
If you have the Viz Tool icon on your desktop, you can drag an existing MineSet visualization file icon and drop it on the Viz Tool icon. The visualization will then display in the Viz window.
You can also drag a visualization file into an open Viz Tool window. If you have your preferences set to Single Document mode, you must drop the file icon onto the title bar of the Viz window. If you have your preferences set to Multiple Document mode, you can drop the file icon anywhere within the window, and it will display.
When the Tree Visualizer is selected, the Data Destinations panel shows visual elements to which you can map the attributes from your data (Figure 5-2). Select columns from the pulldown menu next to each visual element. Table 5-1 lists the visual elements along with comments on their use. Often the best way to use the Tree Visualizer is to experiment with the element mapping until you come up with the best combination of attributes and visual elements.

Table 5-1 lists the visual elements.
Table 5-1. Tree Visualizer Visual Elements
Visual Element | Comments |
|---|---|
Key - Bars | Use this to specify what the bars represent. If the column is numeric, it is often best to bin the column. Otherwise, MineSet creates a bar for every value of the attribute, which can make the visualization difficult to work with. |
Height - Bars | Use this to specify what the bar heights represent. Typically, the higher the bar, the greater the value represented. See the tool options panel for options on aggregating the attribute at each level. |
Height - Disks | Use this to specify what the heights of the disks represent. The optional disks are placed at the same locations as the bars. Disks are most useful if the disk attribute is in the same unit of measurement as bar height attribute (for instance, this year's sales and last year's sales). If no mapping is specified, no disks are displayed. |
Height - Bases | Use this to specify what the base heights represent. If no mapping is specified, the bar height mapping is used. See the tool options panel for options on aggregating the attribute at each level. |
Color - Bars | Use this to specify what the bar colors represent. You can assign the specific colors via the Tool Options panel (See the “Color Selection” entry in the MineSet Enterprise Edition Reference Guide, or allow MineSet to automatically assign colors. See the tool options panel for options on aggregating the attribute at each level. |
Color - Disks | Use this to specify what the disk colors represent. You can assign the specific colors via the Tool Options panel (See the “Color Selection” entry in the MineSet Enterprise Edition Reference Guide), or allow MineSet to automatically assign colors. This option has an effect only if the disk height is specified. |
Color - Bases | Use this to specify what the base colors represent. You can assign the specific colors via the Tool Options panel (See the “Color Selection” section in the MineSet Enterprise Edition Reference Guide), or allow MineSet to automatically assign colors. See the tool options panel for options on aggregating the attribute at each level. If no mapping is specified, the bar color mapping is used. |
Sort By | Use this to sort the layout of the nodes by the values of the selected attribute. The sort order defaults to ascending from left to right. |
Tree Hierarchy | Use this to specify how the table from your data source is converted into a hierarchy. The second level of the tree will have as many nodes as there are values for the selected attribute. If the attribute has many possible values, the tree will be large and difficult to analyze. Binning the column can alleviate this. |
Tree Hierarchy | Use these to split your data into more hierarchies. The Visual Elements list defaults to three hierarchical levels. If you specify a third hierarchy level, the Tree Visualizer automatically adds a fourth. With every extra level you specify, another one is added. You can specify as many hierarchy levels as necessary. If the attribute has many possible values, the tree will be large and difficult to analyze. Binning the column can alleviate this. |
When the Tree Visualizer first launches, the root node of the hierarchy is at the front of the scene, near the bottom of the main window. In back of the root node are its descendents. Each node consists of a base with bars on it. You can change what the heights and colors of the bars represent via the Tool Manager or by manually changing the .treeviz configuration file (see the “Tree Visualizer” entry in the MineSet Enterprise Edition Interface Guide ); usually, the base represents the aggregate of all the bars. Bases are connected with edges representing the connection of the nodes to their descendents.
Values in subgroups can be summed and displayed automatically in the next higher level. The base under the bars can provide information about the aggregate value of all the bars. Bars representing negative values are shown below the top of the base. You can see negative value bars more clearly by disabling the base height (see “Fine-Tuning the Tree Visualizer Display”, or the “Tree Visualizer” entry in the MineSet Enterprise Edition Reference Guide ).
Figure 5-3 shows the opening scene for the stores.treeviz file. This file is in the MineSet 3.1\examples directory, in the location where MineSet was initially installed. To see it from the Tool Manager Visual Tools menu, open the 3D Visualizer; then, from the Tree Visualizer File menu, choose Open. Each record in the data file contains the following columns: region (eastern, southern, central, or western), state, city, store number, product type (appliances, clothing, electronics, or furniture), this year's sales, last year's sales, and target sales. Two new columns have also been added: the percentage of the target sales attained this year, and the percentage of last year's sales attained this year. Table 5-2 shows the mapping of columns to the Tree Visualizer's visual elements.
The bars in the top node of the tree represent total sales for each product. The disks represent the target sales. The next level down splits the sales by region, the next by state, and so forth, down to the individual stores.
In examining the Tree Visualizer scene, you can see at a glance how well each region, state, city, or store met the target sales for each product type. You can also compare sales across regions, states, product types, and so forth.
Table 5-2 shows the mapping of columns to visual elements for this example.
Table 5-2. Element Mapping for Stores Data
Column | Aggregation | Mapping |
|---|---|---|
Region | None | Hierarchy level 1 |
State | None | Hierarchy level 2 |
City | None | Hierarchy level 3 |
Store ID | None | Hierarchy level 4 |
Product type | None | Key - bars |
This year's sales | Sum | Bar height |
Last year's sales | Sum | None |
Target sales | Sum | Disk height |
Percent of target | None | Bar color |
Percent of last year's sales | None | None |
Mapping is the key to obtaining a meaningful visualization. Until you are familiar with the tool, experimentation is the best way to find the best mapping scheme.
There are two ways to see the details at each node:
Highlighting a node or object (a bar or a base) lets you view the underlying data. (See “Highlighting an Object or Node.”)
Selecting a node or object zooms the viewpoint to that location, and lets you view underlying data. (See “Selecting an Object.”) You can select more than one location at a time. Selecting a node or object also spotlights it. Spotlighting lets you keep track of that location, even if it is far in the distance of the scene.
To highlight an object (a bar or a base), place the mouse over that object. Information about that object appears over the top left of the view area, under the “Pointer is over” label (Figure 5-4). To highlight a node and obtain information about that node, place the pointer over a line leading to that node.

To select an object and zoom to it, click that object. Press the Shift key while clicking to select the object without zooming to it. As long as the object is selected, the information is displayed.
If you press the Ctrl key while clicking an object, the selection of that object is toggled. If the object is currently not selected, clicking selects it, and vice versa. Using this technique, it is possible to select multiple objects simultaneously. While the information in the “Pointer is over” field shows only the information on the last object selected, it is possible to see the values for all selections by choosing Selections > Show Values or by drilling through to the original data behind the selections.
When you select an object, a white spotlight appears on it (Figure 5-5). A yellow spotlight appears when you are searching (see “Finding Specific Objects with the Search Panel”). Spotlights are visible even if the selected object is a descendent node in the far background.
The edges of spotlights are surrogates for an object: when you move the pointer over the edge of a spotlight, the associated object is highlighted, and information about that object appears above the top left corner of the view. Click the edge of a spotlight to select the associated object and (if the Shift key is not held down) to zoom to it. The spotlight is active only on the solid lines along the edges, not the translucent section in the center. Clicking in the translucent area selects objects behind the spotlight.

To open a window with an overhead view of the complete hierarchy (Figure 5-6), choose View> Overview. If you want the Overview to display each time you view the scene, set the Overview option in the configuration file (see the “Overview” section in the MineSet Enterprise Edition Interface Guide ).

The “X” in the Overview window shows your current location. The Overview helps you keep track of your location and viewpoint in the entire scene. It can also help you quickly go to a specific location:
To select a node in the Overview and have the main view zoom to it and spotlight it, click that node. This is similar to clicking the node in the main view.
To zoom your viewpoint to a new location, even if there is no node at that location, click the right and left mouse buttons (or the middle mouse button) at the location.
To search for specific objects in the Tree Visualizer window, choose View > Search Panel. Fill in the search criteria and click Search. For more information about the Search panel, see the MineSet Enterprise Edition Reference Guide .
Once the search is complete, yellow spotlights highlight objects matching the search criteria (see Figure 5-7). To display information about an object under a yellow spotlight, move the pointer over that spotlight; the information appears in the upper left corner, under the label “Pointer is over.” To select and zoom to an object under a yellow spotlight, click the spotlight; if you press the Shift key while clicking, zooming does not occur.

The Marks panel lets you name and store important locations (or viewpoints) for later reference. All marks can be indicated by colored flags in the main view. If the mark represents a selected object, the flag is placed on that object. If it represents a viewpoint position, the flag is placed at that position. To go to the mark, click the flag. All flags can be turned on and off by choosing Mark Flags from the Display menu (see Mark Flags in “Fine-Tuning the Tree Visualizer Display”).
To save a location and place a flag to mark it (optional):
From the Tree Visualizer's View Menu, choose the Marks panel. This opens the window shown in Figure 5-8. If you have not yet placed any marks, the list will be empty.
Click the Mark button to mark the current location in the main window. This displays the dialog box shown in Figure 5-9.
Enter the name you wish to use for the mark and choose a color. The default name is that of the currently selected object. The color you choose controls the color of the flag appearing in the main window and represents the mark.
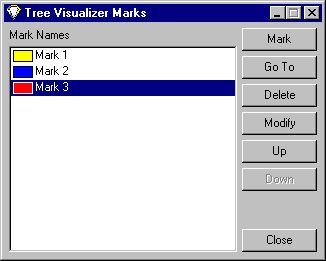
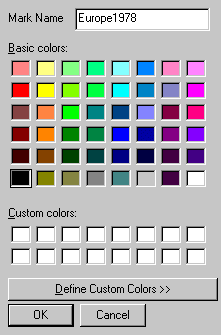
Figure 5-10 shows a sample main window with flags representing the created marks.

The buttons along the side of the Marks window allow you to perform the following tasks:
To go to the location represented with the selected mark in the panel, click the Go to button in the Marks panel. Double-clicking a mark in the panel has the same effect. If the object selected by that mark no longer exists (because it was filtered out, or the data was changed since the mark was created), the location shown is close to where the object would have been.
To delete the selected mark in the panel, click the Delete button.
To change the name or color of the selected mark in the panel, click the Modify button.
To move the selected mark in the panel up the listing order, click the Up button.
To move the selected mark in the panel down the listing order, click the Down button.
The file storing the marks information has the same name as the configuration file, with a .marks suffix appended. Whenever a mark is changed, it is saved to that file. If all marks are deleted, the .marks file is removed. If mark changes cannot be saved (because of a permission error, for instance), a warning appears; this warning is not repeated when subsequent mark changes are attempted.
The Filter panel removes selected information, thus fine-tuning the displayed hierarchy. You can use the Filter panel to emphasize specific information, or to shrink the amount of data for better performance. To access the Filter panel, choose it from the Tree Visualizer View menu. See the “Tree Visualizer” entry in the MineSet Enterprise Edition Reference Guide for more information about using the Filter panel.
Table 5-3 describes several options for fine-tuning the Tree Visualizer display. These options from the Tree Visualizer Display menu let you control some of the display parameters.
Table 5-3. Tree Visualizer Display Parameters
Option | Description |
|---|---|
Base Heights (toggle) | Turns the heights of the bases on and off. To see negative numbers, or to make it easier to compare the bar heights, turn this option off. Turning it on provides summary information about all the bars. The initial value of this toggle can be changed with the “base height” statement in the configuration file. |
Marks Flags (toggle) | Turns the flags representing marks on or off (see “Flagging Important Locations with the Marks Panel”). |
Zeros (submenu) | Controls how objects with zero height are displayed. By default, they are shown like other objects: a solid cube of height zero (a plane). The submenu lets you specify that they be displayed as outlines (appearing as a hollow square), or be hidden completely (not drawn). The initial value of this can be changed using the “zero” option in the configuration file (see the MineSet Enterprise Edition Reference Guide). |
Nulls (submenu) | Controls how objects of null height are displayed. It has the same options as the zero menu; however, the default for null options is to display the objects as an outline. The initial value can be changed using the “null” option in the configuration file (see the MineSet Enterprise Edition Reference Guide). |