Association Rules mine data correspondences, that is, which data instances are likely to occur with other specific instances. This is known as market-basket analysis, based on the metaphor of what products are likely to be purchased together in the same market basket. This chapter covers the following topics:
Sample configuration and data files have been provided to demonstrate the Association Rules features and capabilities. These files are in the \examples directory under MineSet, in the location where MineSet was initially installed.
If you have ever wondered why egg substitutes and waffles are displayed next to one another in the supermarket frozen food display case, you may have seen association rules in action. Association Rules discover relationships and patterns in data—a classic data-driven knowledge discovery process in which correlations that were not immediately apparent become clear, and can be displayed in visual form. Association Rules are particularly useful in discovering patterns in large datasets, with the rules of association indicating the frequency of items occurring together in a dataset. This is an unsupervised learning algorithm because it does not focus on any one particular attribute. Instead it treats all attributes equivalently, and does a global search for interesting rules.
The development of Association Rules proceeds in two phases: the data file is first processed by the Association Rules Generator, which creates a file usable by the visualizer. Then the file is displayed by the visualizer, which in this case is a Scatter Visualizer.
The Association Rules Generator can generate both simple (one-to-one) and multiway association rules. This section describes simple association rules. For a description of multiway rules, see “Multiway Association Rules”.
A simple association rule states that given that X is true, there is a certain probability that Y is also true. MineSet refers to X as the left-hand side (LHS) of the rule and Y as the right-hand side of the rule (RHS).
Consider a set of items bought by a customer on a single visit to a store. In this context the rule might be: “80% of the people who buy diapers also buy baby powder.” This percentage is known as the confidence of the rule.
In this example, “diapers” is the item on the left-hand side (LHS) of the rule, and “baby powder” is the item on the right-hand side (RHS) of the rule. In this case:
If baby powder appears on the RHS, the LHS can help determine what should be done to boost sales of this item.
If diapers appears on the LHS, the RHS can help determine what products might be affected if the store were to discontinue selling diapers.
The Association Rules Generator processes an input file, then generates an output file consisting of the rules. If X and Y are items in a record, then a rule such as:
X=>Y
indicates that whenever X occurs in a record, expect Y to occur with some frequency.
The strength of the association is quantified by four numbers, summarized in Table 13-1
Table 13-1. Association Rules Components
Measure | Description | Statistical Description |
|---|---|---|
Support | Frequency of LHS and RHS occurring together. | P(LHS ∩ RHS) |
Confidence | Of all occurrences of LHS, the fraction where RHS is also seen, or the support divided by the frequency of occurrence of LHS items. | P(RHS | LHS) |
Expected confidence | Frequency of occurrence of RHS items. | P(RHS) |
Lift | Ratio of confidence to expected confidence. | P(RHS | LHS):P(RHS) |
See the glossary definitions Support, Confidence, Expected Confidence, and Lift. For technical details see the “Association Rules” entry in the MineSet Enterprise Edition Reference Guide .
 | Note: Given only Y and a rule of the form X=>Y, nothing is known about X. Rules specify implications only from the LHS to the RHS. |
You can see the rules of association in graphic form when it is displayed on a grid landscape. The left-hand side (LHS) items are on one axis, and right-hand side (RHS) items are on the other. As shown in Figure 13-1, attributes of a rule are displayed at the junction of its LHS and RHS item. The display can include bars, disks, and labels.

A legend indicating the mapping between displayed attributes (such as bar heights and colors) and the values associated with the underlying rules (such as confidence and support) is displayed at the bottom of the main window.
This section describes how to use the Tool Manager to simplify the task of configuring the Association Rules tool.
This example uses the cars dataset to set up simple associations. You may discover any association between miles per gallon, horsepower, acceleration, weight, engine size, origin, brand, and the year the car was built. For example, did mileage improve over time? Did engines become less powerful?
The simplest way to set up the associations is to follow these steps:
Bring up Tool Manager, and choose a server and choose cars.schema as the data source (see “Starting MineSet”.)
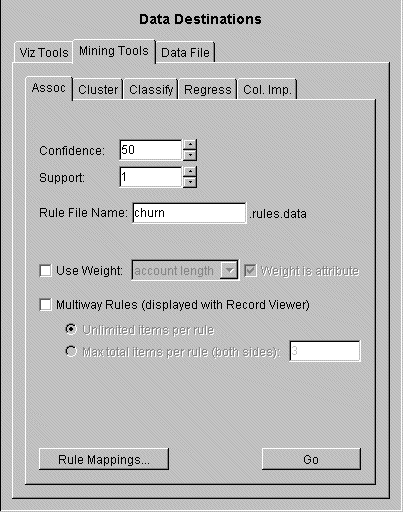
In the Data Destinations pane of Tool Manager, click the Mining Tools tab; from the lower row of tabs, choose Assoc (for Association Rules). Figure 13-2 is displayed.
(Optional step) The algorithm for Association Rules works only with discrete values; therefore continuous-type columns are binned automatically. If you prefer different bins, use the Bin Columns button on the Data Transformations pane. (See “Changing or Creating New Bins for Columns” for details.)
You can run the Association Rules Generator by clicking Go. Or you can choose settings:
Confidence—lets you specify the minimum confidence threshold for rules. Rules with a confidence below this value are not generated. The default is 50%. The possible values are 1–100.
Support—lets you specify the minimum support threshold as a percentage of the total number of records. Rules with a support below this value are not generated. The default is 1%. The possible values are 1–100.
(Optional) Once you have made your association rule options selections, click the Rule Mappings button to map rule attributes such as support, confidence, expected confidence, and lift to visual elements. See “Mapping Rule Attributes to Visual Elements” below.
If you have the Viz Tool icon on your desktop, you can drag an existing MineSet visualization file icon and drop it on the Viz Tool icon. The visualization will then display in the Viz window.
You can also drag a visualization file into an open Viz Tool window. If you have your preferences set to Single Document mode, you must drop the file icon onto the title bar of the Viz window. If you have your preferences set to Multiple Document mode, you can drop the file icon anywhere within the window, and it will display.
The Association Rules allow for record weighting for cases in which you want to specify that certain records are more important than others, or when you want to compensate for uneven sampling. If you do not check the box for Weight by Column, then each record has a weight of one. The Weight by Column box is only active when the dataset contains columns available for weighting.
To enable record weighting, click the Weight by Column checkbox. When the box is checked, a popup menu appears that allows you to choose the column that contains the weight for each record. The Weight is attribute box, if checked, includes the weight column in the rules found by the Association Rule Generator. If the box is unchecked, all records are given equal weight in determining rules found by the Generator. See “Weighting Records” in Chapter 3 for a further explanation of record weighting.
The Association Rules tool lets you map attributes of the rules to visual elements of the display. Clicking on the Rule Mappings button brings up the Mapping Rules to RuleViz Elements panel shown in Figure 13-3.
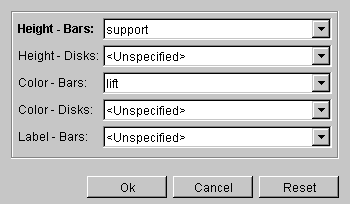
The visual elements that can be mapped are listed below; the items preceded by an asterisk are optional:
Table 13-2. Association Rules Mapping to Visual Elements
Visual Element | Mapping |
|---|---|
Height - Bars | Specifies what the bar heights represent. Default is Support. |
*Height - Disks | Specifies what the disk heights represent. |
*Color - Bars | Specifies what the bar colors represent. Default is Lift. |
*Color - Disks | Specifies what the disk colors represent. |
*Label - Bars | Specifies what the bar labels represent. |
The Association Rules tool displays the data from a rules file in the Scatter Visualizer using the specifications of a valid configuration file. To see a sample file, from the MineSet 3D Visualizer use File > Open to see a list of configuration files. These files are in the MineSet\examples directory, in the location where MineSet was initially installed. For example, specifying brand.rules.scatterviz results in the image shown in Figure 13-4. Files of association rules can be identified by having names ending with.rules.scatterviz.
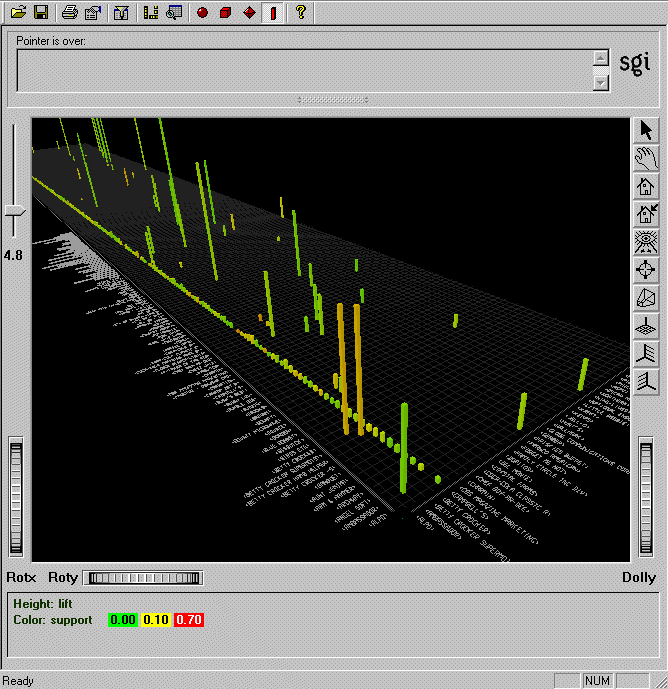
The rules are presented on a grid landscape in the Scatter Visualizer. The left-hand side (LHS) items are on one axis, and right-hand side (RHS) items are on the other. As shown in Figure 13-4, attributes of a rule are displayed at the junction of its LHS and RHS item. For example bar heights correspond to support and bar colors correspond to lift. If the displayed view is too small, item labels do not appear on the sides of the axes. You can zoom in on the view until the item labels appear using the Dolly thumbwheel at the lower right of the window. You can also view the labels for a particular rule by placing the mouse pointer over an individual bar when the mouse is in select mode (see Figure 13-5). All of the details for that particular rule will be displayed in the upper left-hand corner of the view area.
For example, in Figure 13-4, bar heights correspond to support and bar colors correspond to lift.
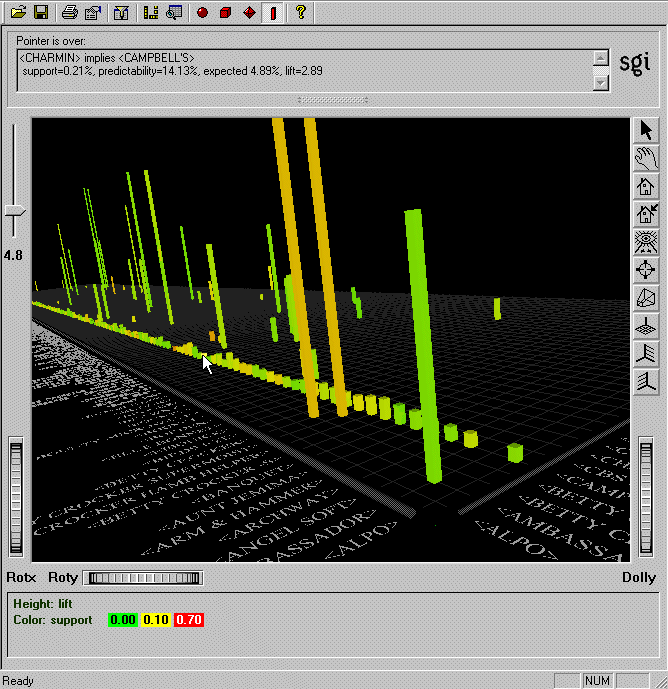
Placing the mouse pointer over an Association Rules object as shown in Figure 13-5 displays that object's information. The information is displayed as long as the pointer remains over the object. If you position the pointer over an object and click the left mouse button, that same information appears in the selection area above the main window. In addition, the bar is selected and appears in a separate window containing all selected rules. Multiple rules may be selected by holding down the Shift key while clicking.
This information remains visible until another object is selected, or until no object is selected (if you click the black background). Using the mouse, you can cut and paste text from the selection window into other applications, such as reports or databases.
The drill-through expression is determined by doing a logical “and” of selected rules. Because the columns in the original table do not match the columns in the .rules.data file, the rules generator produces a special column to help construct the filter expression when a drill-through is performed. This means that changing the drill-through preferences panel has no effect, because a special string-valued column has already been mapped to drill-through in the .rules.scatterviz file.
When you drill through on a rule (or rules), MineSet shows all the records that satisfy the rule (or rules).
In some cases, it is useful to have more complex rules that have multiple items on the LHS and/or the RHS. These are multiway association rules. Figure 13-6 illustrates the Tool Manager Association panel configured for multiway rules generation.
If you check the Multiway Rules check box, the Association Rules Generator generates all rules that satisfy the minimum support and confidence thresholds, including those that have more than one item in the LHS and RHS. An example of such a rule might be “beer and linguini implies potato chips and salsa and wine.”

Multiway rules are displayed using the Record Viewer because there is no obvious way to show the more complex rules in the Scatter Visualizer. They are displayed with one rule per row. The first two columns of the table contain the number of items in the LHS and RHS. The next four columns contain the support, confidence, expected confidence, and lift values. The last two columns contain the LHS and RHS items. In the LHS and RHS columns, the items are separated by the word “and.” In the example rule above, the LHS contains two items and is represented as “beer and linguini.” The RHS contains three items and is represented as “potato chips and salsa and wine.”
You can limit the size of the rules generated by entering a number in the “Max total items per rule” field. This number indicates the maximum number of items that are allowed in any rule. The number of items in a rule is the sum of the number of items in the LHS and RHS. The example rule above has three items; simple rules have two items.
| Note: Generating multiway rules can take a long time. Watch the Tool Manager status window for an indication of the number of rules generated at each iteration. If too many rules are being generated, cancel the operation and increase the minimum support or confidence thresholds, or decrease the maximum allowable number of items per rule. |