The purpose of clustering is to determine what elements or characteristics in the dataset are similar. This is useful for exploring a fresh dataset. For example, the iris dataset shows three clearly discriminated clusters around iris type—iris-setosa, iris-versicolor, and iris-virginica. This chapter includes the following topics:
Clustering is a descriptive data mining task, so you do not specify a column as a label. For this reason, Clustering is categorized as an unsupervised learning algorithm. Clustering models are always built from and evaluated on the full dataset.
MineSet forms clusters by grouping similar records together, aiming to maximize the overall similarity within each group. MineSet provides two distinct modes of clustering, single and iterative k-means, both of which are explained in depth in the “Clustering” entry in the MineSet Enterprise Edition Reference Guide .
Once the clustering has been run, you can view the Cluster centers directly using the Cluster Visualizer, which shows the independent attributes in a dataset. You can examine the most prominent, and see how each differs. However, to see how attributes relate to each other between clusters, the Scatter Visualizer and Decision Table provide a clearer view.
To view the clustered model using the Scatter Visualizer, you need to determine which columns should be mapped to the various axes by using the Column Importance tool. First use the Apply Model facility (see “Applying a Predictive Model”), and select the <datasetname>.cluster from the list of available models. The provides you with a new “Cluster” column. Map that column to color in the Scatter Visualizer.
Clustering has no prerequisites and no required options. By default, MineSet uses the single k-means clustering method to discover three clusters in the data. Once the clustering is complete, you see an evaluation of the clustering, and then the Cluster Visualizer appears.
From the Tool Manager Data Destinations pane, click Mining Tools, and click the Cluster tab, as shown in Figure 12-1.
To control the choice of clustering method, from the Method popup menu choose either single or iterative k-means, as shown in Table 12-1.
Table 12-1. Clustering Method Options
Method
Description
Single k-means
Default method. Specify number of clusters to find (default 3).
Iterative k-means
Requires upper and lower boundary and Choice Point (a number between 0 and 1—default 0.5).
See the glossary definition for Choice Point.
Click Go.

 | Note: Clustering is a computationally intensive operation and can take some time to complete on larger datasets, especially when running in iterative k-means mode. If your dataset has more than 10,000 records, try clustering a sample of the data. |
Clusters are assigned sequential numerical names starting from 1. Although cluster names are represented by numbers, there is no ordering to the clusters.

In iterative k-means, clusters are named based on their derivation during the splitting process. The initial clustering (based on the minimum number of clusters) is named using sequential numbers, just as in single k-means. When a cluster is split, the two new clusters are named after the split cluster, with an “A” or a “B” appended. For example, the cluster named “2-B-A” was derived from cluster 2 in the initial clustering, and was split twice.
For details on the operation of the clustering algorithm, see the “Clustering” entry in the MineSet Enterprise Edition Reference Guide .
If you have the Viz Tool icon on your desktop, you can drag an existing MineSet visualization file icon and drop it on the Viz Tool icon. The visualization will then display in the Viz window.
You can also drag a visualization file into an open Viz Tool window. If you have your preferences set to Single Document mode, you must drop the file icon onto the title bar of the Viz window. If you have your preferences set to Multiple Document mode, you can drop the file icon anywhere within the window, and it will display.
A cars sample dataset provided with MineSet is relatively simple, dealing with familiar concepts of horsepower, vehicle weight, and time required to reach 60 mph.
Using the Tool Manager File > Open New Data File pulldown menu, select the cars.schema file. Look in the directory in which MineSet is installed under \data.
In the Tool Manager Data Destinations pane, click the Mining Tools tab.
Click the Cluster tab, leave the Method as Single k-means, and the number of clusters as 3, then click Go in the lower right.
In the resulting Cluster Visualizer window (Figure 12-3), click the green bar showing cluster 1, which controls the priority ordering of attributes represented by the bar charts and histograms. When you click on cluster 1, the attribute importance (that is, the order in which the histograms are presented, reading from top to bottom) is cylinders, cubic inches, horsepower, weight lbs, then miles per gallon. This order of importance is only controlled by this cluster for the visualization.
Compare the same row across the other clusters to see how that attribute differs from cluster to cluster.
Select cluster 2, and notice a difference in the order of attributes. In this case, origin is more important, then brand, then cubic inches, cylinders, weight lbs, then horsepower, then miles per gallon.
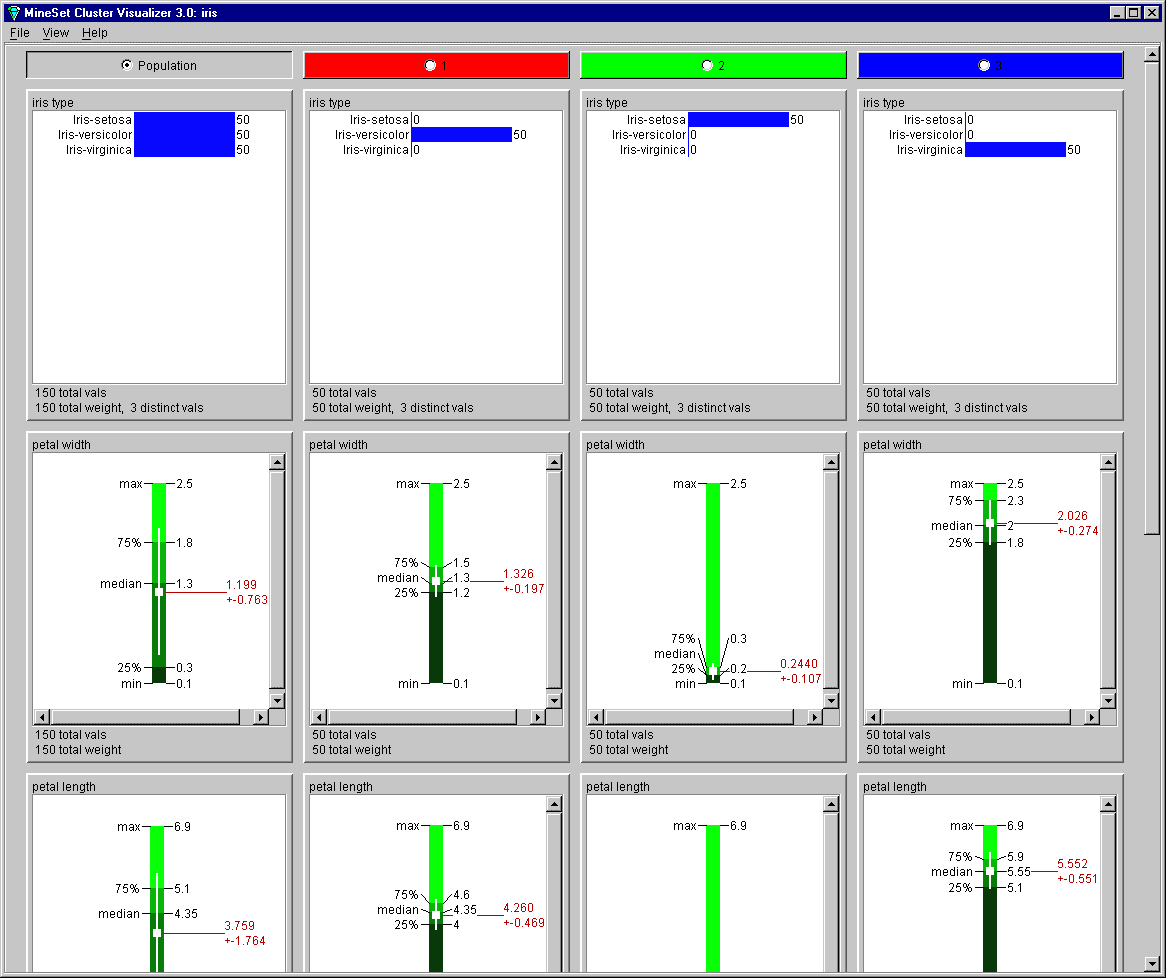
The Cluster Visualizer shows box plots arranged in rows and columns. One row is shown for each attribute in the data, and each column represents a cluster which is named in the top pane. The Population column displays statistics for the dataset as a whole.
By following the procedure in “Starting Clustering with Tool Manager”, you achieve a display similar to that shown in Figure 12-3, with the clusters numbered sequentially. The algorithm cannot detect what the clusters represent, and human interpretation is required. The order in which attributes are displayed in the Cluster Visualizer window is significant; by default, attributes are displayed in order of importance for discriminating between the clusters.
To change the order of the columns:
Click the pane containing the name of a cluster to redisplay the attributes in order of importance for discriminating that cluster from all others.
Click on the pane containing “Population” to restore the default ordering.
The Cluster Visualizer provides an easy-to-use basic visualization of the clustering. However, it is not the only way to visualize clustering. An example of transferring the results of clustering into a display using the Scatter Visualizer is shown in the MineSet Enterprise Edition Tutorial . The main idea is to create a new column by applying the just-built clustering model, then using the visualizer of choice. The Scatter, Evidence, and Decision Table Visualizers are particularly useful for viewing clustering results.