This chapter introduces the subject of data mining and how MineSet tools work in that context. If you already know about MineSet, you can skip this chapter. The subjects covered here are:
MineSet is an integrated tool suite for data analysis. MineSet's graphical user interface can be used by marketing and sales specialists, financial analysts, insurers, indeed anyone wanting to analyze data. MineSet also provides interfaces for application developers wishing to write decision support applications for business and scientific purposes.
The use of basic data mining terms is outlined here and in the glossary at the end of the book. For instance, in this context, data is a collection of records, often initially gathered when a business or scientific process is performed, such as customer billing, pharmaceutical testing, or point-of-sale transactions. These records are organized for MineSet in table form with rows and columns. The table could be given a descriptive name like “Customers,” representing all records about customers of a particular enterprise. In the context of data mining, columns are often referred to as attributes, and rows may be referred to as instances or records.
Among the algorithms or mathematical formulas MineSet uses, some are called inducers because they induce the model to be built. The models themselves are called classifiers simply because they classify the rows and columns of data. Hence, you can take the record contents of rows and columns and sort or classify them in many ways.
The purpose of data mining is to discover patterns in data so that this knowledge can be applied to solving problems. Typical problems solved by data mining include:
Fraud detection
Churn analysis
Calling pattern analysis
Target marketing
Determining market segmentation
Improving operational procedures
Improving medical service
Market basket analysis
When you use queries or online analytic processing (OLAP) to gather information about data from a database, you must specify directly any relationships between data elements. For example, you might query for all the sales by region. This method presupposes you have an idea that sales vary by region, and so you test that hypothesis against data to confirm or reject its validity.
It is at this juncture that OLAP moves in the direction of discovery-based data mining, where relationships may be uncovered that you did not know existed. This method allows the data itself to suggest conclusions to the investigator. It is this ability to discover the previously unknown that distinguishes data mining from OLAP and other approaches to data mining such as queries.
Visual data mining presents data in a revealing visual form allowing you to see trends and tendencies just by looking at the visualization. This human ability to visualize and survey complex data patterns can prove invaluable in making decisions. Such visual data mining is descriptive, that is, it describes existing data that has been measured or quantified.
Analytical data mining uses algorithms to automatically develop models derived from your data. These algorithms then run through the data in various ways, depending on the algorithmic method chosen. You can display the results of your data analysis in visual form, test them against untried data, or fit models on a completely new set of data. Analytical data mining uses the model to predict the characteristics of the next piece of data presented.
Analytical data mining results in models about the data. It does this by using algorithms that fall into two broad categories—supervised and unsupervised modeling methods.
In MineSet, the combination of visualization with mining models provides the user with greater insight than either technique applied independently.
In this discussion, data appears in a table consisting of columns and rows. Data records are represented by rows: the data attributes are represented in the columns of the table (see Figure 1-1).

Supervised modeling is a task in which the goal is to predict the content or value of one column (attribute) in a record, based on the values of other columns (attributes) in that same record. You intend to predict a special attribute or characteristic. This attribute is called the label. By encoding the relation between the label and the other attributes, the model built by a supervised modeling algorithm can be used to make predictions about new, unlabeled data.
You can then visualize the model to gain insight into the relationship between labels and other attributes. For example, if customers have left your company (typically called attrition or churn), you can build a model that not only predicts which customers are likely to churn, but also helps you understand the reasons and patterns that lead to this behavior.
The two most common supervised modeling tasks are called classification and regression. If the label is discrete (that is, it contains a fixed set of values—for example, “yes” or “no”), the task is called classification; if the label is a continuous value (that is, it can take a value in a continuous range—for example, income or stock price), the task is called regression.
Classification is the task of assigning a discrete label value to an unlabeled record. In doing so, records are divided into predefined groups. For example, a simple classification might group customer billing records into two specific classes: those who pay their bills within 60 days and those who take longer than 60 days to pay. Further data classification examples might divide customers by sex or income. The process of classification can also predict the probability that the label will take on a specific value. For example, you can compute the probability that a person will pay the bill within 60 days.
In creating these classifications, MineSet utilizes algorithms that induce (build) models based on the data you give it. MineSet can induce a classifier automatically from a training set. A training set is a random subset of the original data. For example, you may decide to use just 40% of the data to build the model. Once a model is generated, it can be used to classify or predict class probabilities for records with unknown values of the label. For instance, when new records are added to the table, the value of the label may not be known. When this happens, the model can predict the value of the label column. If the value of the label is later found to be the same as the value predicted, the model is said to be correct. The part of the original dataset not used for training may be used to test the accuracy of the induced model.
MineSet can induce four classification models, each one of which can be viewed using a visualizer. These models are different, based on the way the algorithm makes decisions in sorting and classifying the data. For example, a Decision Tree might segment records of telephone calls into two groups based on customers who talk for more than or less than 256 minutes. An Option Tree might give you three choices of ways to search for customers likely to churn. These differences are detailed in “MineSet Tools for Data Mining”, and examples are shown in later chapters.
Regression is a supervised modeling task similar to classification, except that the values that the label can take are continuous, not discrete. For example, predicting salary or the price of a stock is a regression, whereas predicting whether a salary is one of many given ranges (for instance, less than $60K, between $60K and $120K, more than $120K), or whether a stock will go up or down, is a classification task.
MineSet can also induce regressors automatically from a training set or sample of the data. Once a regressor is generated, it can be used to predict values for the continuous attribute in question, such as a salary of $60,420. MineSet currently has one regression model: the Regression Tree. Like all other models built by MineSet, a Regression Tree model can be visualized with a MineSet visualization.
Estimating the accuracy of supervised models is an important part of the data mining process. Classifiers are usually evaluated according to their error rate, or proportion of misclassified records. Regressors are evaluated according to their absolute error of the standard deviation in their predictive error. When assessing the accuracy of a model, it is important to test it on data that was not used in building the model.
Unsupervised modeling discovers rules and segments of the data that behave similarly. There is no notion of a correct answer, or any obvious agreed-upon measure of performance. Unsupervised modeling provides insight into the data as a whole by showing patterns and segments that are similar. The models cannot be used directly to make predictions; therefore it is not necessary to set aside part of the data as a training set from which to build the classifier. MineSet provides algorithms for the two most common unsupervised modeling: associations and clustering.
In generating associations, the task is to describe by what rules A implies B. The classic association grouping is market basket analysis, reporting the frequency with which certain items are purchased at the same time. For example, observing that purchasing baby food implies a higher probability that a customer will buy low-tar cigarettes rather than regular cigarettes might help stores arrange their shelves differently.
Clustering algorithms segment the data into groups of records, or clusters, that have similar characteristics. For instance, a health-insurance company may discover that these characteristics define a segment: 20-to-45 years old, technical worker, fewer than two children, television science-fiction fan, and a disposable income of $5,000 to $10,000 per year. The segment can then be targeted more effectively with a health-insurance package well suited for these people, by using television ads in new science-fiction episodes.
A data mining algorithm can be complemented with data visualization techniques, taking advantage of the human brain's amazing pattern recognition capability. The following MineSet visualizers are working examples:
Map Visualizer—Data is displayed on a map, commonly a geographical map.
Scatter Visualizer—Data points are shown in one, two, or three dimensions. Additional attributes can be mapped to color and size. Two other attributes may be mapped to sliders, allowing animation and fly-throughs, and an eighth attribute can be mapped to a color code to guide animations through potentially interesting combinations of values of the animation variables. The Column Importance operation in MineSet can help you identify the important dimensions to map for a given task.
Splat Visualizer—Similar to the Scatter Visualizer, with the distinction that data density is shown by using varying opacity. The result approximates the effect of rendering each data point individually, and is particularly useful for datasets that may contain too many points to display in the Scatter Visualizer.
Tree Visualizer—Data is mapped to nodes in order to see hierarchical breakdowns of the data. Decision Trees, Option Trees, and Regression Trees all show data in a variety of branching tree-like visualizations.
If you have datasets that require classification, regression, association, and clustering, you will find these MineSet tools useful:
Decision Tree Inducer and Visualizer—Induces a classifier resulting in a branching format decision tree visualization.
Option Tree Inducer and Visualizer—Induces a classifier similar to a decision tree inducer and classifier. However, it builds alternative trees and averages them during classification, usually leading to improved accuracy.
Evidence Inducer and Visualizer—Creates its own classifier and produces a visualization to display evidence based on the data provided.
Decision Table Inducer and Visualizer—Creates a hierarchical visualization displaying pairs of dimensions at every level. You can drill up to get an overview, and drill down to see detail quickly, while maintaining context.
Regression Tree Inducer and Visualizer—Induces a regressor that predicts real valued attributes, that is, results with gradations of value rather than specific predetermined limits. The structure of the regressor is viewed using the Tree Visualizer.
Association Rules—Encodes rules that govern associations in which A implies B, commonly called market basket analysis. The rules are shown using the Scatter Visualizer, typically with bars and disks.
Clustering Algorithm—Groups data according to similarity of characteristics, then displays it as a series of box plots and histograms, similar to the Statistics Visualizer. The clustering algorithm displays results using the Cluster Visualizer by default, but other visual tools may be used as an alternative.
Column Importance—Determines the importance of specific columns in discriminating one label value from another. Used to observe the varying effects of changing variables, or to suggest columns to map to the axes of the Scatter and Splat Visualizers.
MineSet contains additional tools to aid the knowledge discovery process:
Statistics Visualizer—Displays data in the form of box plots and histograms, one per column. Continuous columns are shown as box plots; discrete columns are shown as histograms.
Histogram Visualizer—Displays data in the form of histograms, one histogram per column of data, binning continuous columns if necessary.
Record Viewer—Displays original data as a spreadsheet.
This section introduces the specific tasks involved in the knowledge discovery process. The process is iterative, commonly going back to earlier stages once you discover new patterns and improve your understanding of the data, as shown in Figure 1-2.
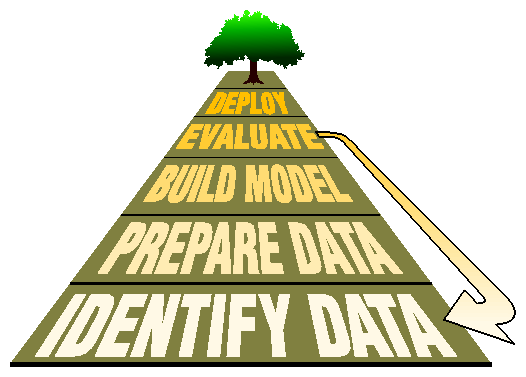
The process follows these steps:
Identify the source of the data—see “Identifying the Data”.
Prepare the data—see “Preparing the Data”.
Build a model—see “Building a Model”.
Evaluate the model—see “Evaluating a Model”.
Deploy the model—see “Deploying a Model”.
The task of identifying the data begins by deciding what data is needed to solve a problem. For example, predictability about customer behavior is often a necessary goal. Recast in terms of a problem, the investigator must identify the data needed for a solution and explore other possible sources of data.
Data may be in a difficult location or in an obscure form. Sometimes there are several initial databases that may be incompatible with each other. Further, if data is scanty or incomplete, more data may be needed. The form in which new data is to be collected depends on the form of existing data. MineSet supports native interfaces to several commercial databases (Oracle, Informix, SQL), ODBC interface, as well as reading data from different file formats (tab-separated flat file, MineSet binary file, Excel, SPSS, MATLAB, etc.). Tools such as DBMS/COPY from Conceptual Software, Inc., allow you to convert data from over 100 formats to a format used by MineSet, and the MineSet Import Data capability (available from the Tool Manager File menu) performs a similar conversion (see the MineSet Enterprise Edition Reference Guide and MineSet Enterprise Edition Interface Guide for details).
Data may need modification before loading into MineSet (a step often called cleaning). Specifically, the following problems are common:
Data may be in a format incompatible with MineSet representation (for example, binary, encoded, or EBCDIC strings from old mainframe computers).
Data may be misspelled or erroneous, or have incomplete, or erroneous values.
Field descriptions may be unclear or confusing, or may mean different things depending on the source. For example, order date may mean the date that the order was sent, postmarked, received, or keyed in.
Data may be out of date; for example, customers may have moved, changed households, or changed spending patterns.
Even clean data may need to be transformed before it is suitable for mining and visualization.
Transformations can greatly improve model performance. If you were analyzing telephone company data, for instance, you may find that long distance rate (sales divided by total minutes used) is a better predictor of customer behavior than either element given separately. Data transformations are at the heart of developing a sound model. As you progress, you may even go back and transform the data differently. You can transform the data by:
Adding columns, usually by applying a mathematical formula to existing data to create a new field.
Removing columns that are not pertinent, are redundant, or contain obvious, uninteresting predictors.
Filtering data based on a boolean expression of column values to influence the model or visualization. For example, you may want to see only the strongest rules or the most profitable customer segments.
Binning data—breaking up a continuous range of data into discrete segments (for instance, [1 - 10], [11 - 20], and so on).
Aggregating data—grouping records together, and finding the sum, maximum, minimum, or average values.
Sampling the data to get a random subset of the data (by percentage or count).
Applying a classifier, regressor, or clustering model that you have previously created, to label new records with a class label, or to estimate the probability of a given label value.
In MineSet, most of these transformations take place using the Data Transformation pane in Tool Manager. Plug-in modules may be available to create transformations or a particular kind of model.
At the core of the knowledge discovery process is model building, automatically done by analytical data mining algorithms. You can build the model using all the data you have, or you may hold back part of it with which to test the accuracy of the model. Building a model offers you several options in the way you induce the model. These choices influence not only the way the visualization is presented but also the decisions the algorithm makes in building the classifier. These choices are discussed further in Chapter 7, “Understanding Predictive Modeling.”
Evaluating the accuracy of a model refines your understanding of that model and its usefulness. Some models, notably the Decision Tree classifier and the Option Tree classifier, evaluate different parts of the model and display them directly through visualization.
MineSet implements four model-assessment methods: error estimation, confusion matrix, lift curve, and ROI (return-on-investment) curve. These methods are explained in Chapter 11, “Refining Predictive Modeling.”
A model can be deployed by applying it to new data. New data can give rise to further questions, which may require further refinements.
In the telecommunications example in the MineSet Enterprise Edition Tutorial , a model was created to determine which customers were likely churn (that is, leave their phone carrier). Customer records could then be evaluated through the model to identify the specific customers most likely to churn. These customers could then be offered incentives to stay.
You can step through the knowledge discovery process on the churn dataset—a prepared dataset of telecommunication customers that is included with the MineSet software. As you work through the examples in this guide, think how your business or scientific operations progress forward and loop back to establish a fully tested analytical data mining model.
In the next chapter, Chapter 2, “Accessing Data with MineSet,” you can begin working directly with MineSet and the sample files that have been provided.