This chapter surveys data mining methods, model building and assessment, and the role of MineSet in connection with these topics:
The purpose of data mining is to discover patterns in data so that this knowledge can be applied to problem solving. Analytical data mining integrated with powerful visualizations presents new pathways to knowledge discovery. The data mining system can automatically find and show you new patterns that can lead to fresh insight. Examples of this might be determining correlations among attributes, discriminating among subsets of the data with differing characteristics, and inferring probabilities of future events from historical data.
In ordinary database queries or online analytic processing (OLAP), you must specify directly any relationships between data elements. Data mining can discover relationships that may be unknown or unseen by you.
Data to be analyzed, or mined, is often initially retrieved when a business or scientific process is performed, such as acquiring data from customer billing, pharmaceutical testing, or point-of-sale transactions. The amount of data retrieved may be so large as to preclude analysis by means other than data mining. Such data, once properly transformed, is often stored in a data warehouse. See “Preparing the Data” for further details.
The data files that MineSet uses can be thought of as large tables. The rows are the individual records, and the columns are the attributes for each record. The label in classification tasks is a specific value of the attribute chosen for classification. For instance, in the example file used throughout this tutorial (churn), the task is to classify the records into customers who have quit the company (churned) and those who have not. The label attribute (column) is “churned,” and the possible label values are “yes” and “no.”
A discrete label is one that can have only a limited number of values, such as gender, salary ranges (for instance, less than $40,000; $40,000 to $80,000; and over $80,000), and age ranges (for instance, under 21, 21 to 35, 36 to 50, and over 50). A continuous label can have any value in a large range, for example, yearly salary, yearly sales, and miles per gallon.
Data mining combines hypothesis testing and data-driven discovery. In hypothesis testing, the investigator tests an idea against a body of data to confirm or reject its validity. In some cases, the data itself may drive discovery. In discovery, the investigator draws conclusions from the data, allowing the data itself to suggest conclusions. Often data mining problems are resolved by using a blend of both methods. For example, conclusions may give rise to new hypotheses that can be tested and confirmed or rejected. Data mining is where statistics and machine learning converge.
The MineSet suite of tools lets you analyze, mine, and graphically display data so that you can visualize, explore, and understand your data. You can organize and examine your data in different ways. The mining tools automatically find patterns and build models that can be viewed using the visualization tools. When you apply the visualization tools directly to the data, you gain a deeper, intuitive understanding of your data, often discovering hidden patterns and important trends.
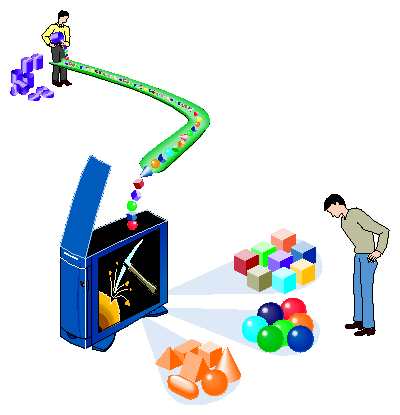
The results of a typical analytical data mining operation in MineSet include both a model describing the data and a visualization of the model. This visualization is a 3D interface that lets you manipulate objects interactively, as well as perform animations. The visualization allows you to understand the model, and survey complex data patterns to gain invaluable insight when making decisions. MineSet is an integrated system in which the analytical algorithms can generate the visualization, and you can select visualization elements for further mining.
Analytical data mining algorithms automatically build models from the data. Two families of modeling algorithms are commonly used—supervised and unsupervised. Predictive modeling tasks, where the goal is to predict the value of one column based on the values of other columns, are called supervised tasks. These tasks are similar to the supervision of a teacher who gives you the correct answer for the question, to teach you.
The goal in descriptive modeling is to discover patterns and segments of the data. These are unsupervised tasks. There is no notion of a correct answer nor an obvious agreed-upon measure of performance. Unsupervised tasks provide insight into the data as a whole by showing patterns and segments that behave similarly.
In supervised modeling, there is a special attribute called the “label” that you intend to predict. By encoding the relation between the label and the other attributes, the model can make predictions about new, unlabeled data. In addition, by visualizing the model itself, you can gain insight into the relationship between labels and other attributes. For example, if a customer has left your company (typically called attrition or churn), you can build a model that not only predicts which customers are likely to churn, but also help you understand the reasons and patterns that lead to this behavior.
The two most common supervised modeling tasks are called classification and regression. If the label is discrete (that is, containing a fixed set of values), the task is called classification; if the label is a continuous value (that is, can take a value in a continuous range—for example, income, or stock price), the task is called regression.
Classification is the task of assigning a discrete label value to an unlabeled record (see “Terms Used in This Tutorial” for definitions of these terms). In doing so, records are divided into predefined groups. For example, a simple classification might group customer billing records into two specific classes: those who pay their bills within 60 days, and those who take longer than 60 days to pay. Other data classification tasks might divide customers by gender or income. Classifiers can also predict the probability that the label will take on a specific value for a particular record. For example, MineSet can compute the probability that a certain customer will pay his or her bill within 60 days, given the values of other attributes in the customer's record.
A classifier is a model that predicts one attribute of a set of data when given other attributes. MineSet can induce (build) a classifier automatically from a training set (a subset of the dataset.) When a classifier is induced, MineSet also generates a visualization of the model that can help you understand how the classifier operates, thus providing valuable insight. Once a classifier is generated, it can be used to classify or predict class probabilities for unlabeled records (that is, for records that are missing the label attribute). This concept is explained further in Chapter 3.
MineSet has inducers for four classification models: Decision Trees, Option Trees, Evidence (Simple Bayes), and Decision Table Classifiers. Each model can be viewed using the 3D Visualizer.
Regression is a supervised modeling task similar to classification, except that the label is not discrete. For example, predicting salary or the price of a stock is a regression, whereas predicting whether the salary is in a given range or whether a stock will go up or down is a classification task.
Predictive models are rarely perfect, therefore estimating their accuracy is an important part of the data mining process. The tool used to measure accuracy depends on the model type. Classifiers are usually evaluated according to their error rate. The most common such measure is misclassification, or proportion of misclassified records. When assessing the accuracy of a model, it is important to test it on data that was not used in building the model. MineSet provides a number of methods for evaluating errors. See Chapter 4, “Further Explorations,” for details.
In unsupervised modeling, the aim is to discover rules and segments of the data that behave similarly (clusters). Unsupervised modeling is a descriptive task, not a predictive task. The models cannot be used directly to make predictions, hence it is not necessary to set aside part of the data as a test set with which to validate the classifier. MineSet provides two methods for unsupervised modeling—associations and clustering.
To generate associations, the task is to determine rules of implication between data attributes A and B, such that A implies B. Associations are often used to find affinity groupings that discover what items are usually purchased with others. The classic affinity grouping is market basket analysis, predicting the frequency with which certain items are purchased at the same time. For example, discovering that baby food implies a higher probability that a customer will buy low-tar cigarettes rather than regular cigarettes might help stores arrange their shelves differently.
Clustering algorithms segment the data into groups of records, or clusters, that have similar characteristics. For instance, a health-insurance company may discover that these characteristics define a segment: 20-to-45 years old, technical worker, fewer than two children, television science-fiction fan, and a disposable income of $10,000 to $20,000 per year.
The segment can then be targeted more effectively with a health insurance package well-suited for these people, by using television ads in new science-fiction episodes.
An analytical data mining algorithm can be complemented with data visualization techniques taking advantage of the human brain's amazing pattern recognition capability. The following MineSet visualizers are available:
Map Visualizer—Data is displayed on a map, commonly a geographical map.
Scatter Visualizer—Data points are shown in one, two, or three dimensions. Additional attributes can be mapped to color, size, and shape. Finally, two additional attributes may be mapped to sliders, allowing animation and fly-throughs, for a total of eight dimensions. The column importance operation in MineSet can help you identify the important dimensions to map for a given task.
Splat Visualizer—Similar to Scatter Visualizer, with the distinction that data density is shown by opacity of color, which appears as a blurred translucent cloud. The result approximates the effect of rendering each data point individually.
Tree Visualizer—Data is mapped to nodes in order to see the hierarchical breakdowns of the data.
If you have data mining problems requiring classification, regression, and clustering, you will find these MineSet tools useful:
Decision Tree Inducer and Classifier—Induces a classifier resulting in a decision tree visualization.
Option Tree Inducer and Classifier—Induces a classifier similar to a decision tree inducer and classifier. However, it builds alternative options and averages them during classification, usually leading to improved accuracy.
Evidence Inducer and Classifier—Creates its own classifier and produces a visualization to display evidence based on the data provided.
Decision Table Inducer and Classifier—Creates a hierarchical visualization displaying pairs of dimensions at every level. You can drill up and drill down quickly, while maintaining context.
Clustering Algorithm—Groups data according to similarity of characteristics, then displays it as a series of box plots and histograms, similar to the Statistics Visualizer. The clustering algorithm displays results using the Cluster Visualizer by default, but other visual tools may be used as an alternative.
Regression Tree—Induces a regressor that predicts a real value, that is, results with gradations of value rather than specific predetermined limits.
Column Importance—Determines the importance of specific columns in discriminating one label value from another. Used to observe the varying effects of changing variables, or to suggest columns to map to the axes of the Scatter and Splat Visualizers.
MineSet contains additional tools to aid the knowledge discovery process:
Statistics Visualizer—Data is displayed in the form of box plots and histograms, one per column. Continuous columns are shown as box plots, discrete columns are shown as histograms.
Histogram Visualizer—Data is displayed in the form of histograms. Continuous columns are binned (broken down into ranges).
Record Viewer—The original data is displayed as a spreadsheet.
The next chapter, Chapter 2, describes a typical data mining process and how the tools are used.