This chapter discusses the features and capabilities of the Statistics Visualizer. It provides an overview of this data visualization tool, then explains the Statistics Visualizer's functionality when working with the
main window
external controls
pulldown menus
Finally, it lists and describes the sample files provided for this tool.
The Statistics Visualizer lets you visualize statistics on columns. Statistics Visualizer presents a window that contains one small panel for each column listed in the Current Columns pane of Tool Manager. The Statistics Visualizer main window has a default size and shows only a restricted number of column panels. If the number of columns is large, scrollbars appear; alternatively, you can stretch the Statistics Visualizer window horizontally or vertically to view more column panels.
The format of the column panel varies according to the column type, and the number of distinct values that exist for that column. Columns are generally divided into two types: numeric and discrete, shown as box plots and histograms, respectively.
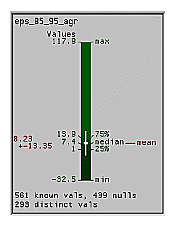
A numeric column has integer, float, double or date values. Each box plot panel shows statistics about data from a single column, including the minimum, maximum, mean, median, and two quartiles (25th and 75th percentiles) of these numeric values. These values are shown as lines across a vertical bar in graduated shades of green, and the standard deviation of the population is shown as a +/- value. The quartiles are shown whenever there are fewer than 50,000 distinct values, (see Figure 4-1). If there are more than 50,000 distinct values in the column, the statistics are shown as a gray vertical bar.
A discrete (or nominal) column has non-numeric (string, bin, or enum) values shown as histograms, (see Figure 4-2). The discrete column panel shows up to 100 distinct values, as well as a histogram of the number of instances of this distinct value. The default ordering of the discrete rows is by decreasing count, but you can use the View pulldown menu to select an alternative sorting. If there are 100 or fewer distinct categories, then the column panel also contains the count of distinct values.
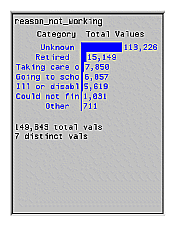
After creating a visualization of your data, the Statistics Visualizer lets you see truncated textual information in the histograms with a brush highlighter. The brush highlighter activates as you pass the mouse across a field without clicking.
The Statistics Visualizer requires a data file, consisting of ASCII or binary fields. This file is easily created when running the Tool Manager (see Chapter 3).
There are five ways to start the Statistics Visualizer:
Use the Tool Manager to configure and start the Statistics Visualizer. See Chapter 3 for details on most of the Tool Manager's functionality, which is common to all MineSet tools.
Double-click the Statistics Visualizer icon, which is in the MineSet page of the icon catalog. The icon is labeled statviz. Since no configuration file is specified, the start-up screen requires you to select one by using File > Open.
Double-click the Statistics Visualizer icon on your Silicon Graphics desktop. The startup screen requires you to select a data file by choosing File > Open.
Starting the Statistics Visualizer from the icon activates only the File and Help pulldown menus. For the main window to be fully functional, open a .statviz file by selecting File > Open.
If you know what .statviz file you want to use, double-click the icon for that file. This starts the Statistics Visualizer and automatically loads the file you specified. This works only if the filename ends in .statviz (which is always the case for data files created for the Statistics Visualizer using the Tool Manager).
Drag the .statviz file icon onto the Statistics Visualizer icon. This starts the Statistics Visualizer and automatically loads the file you specified. This works even if the configuration filename does not end in .statviz.
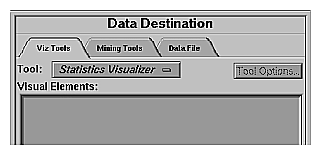
Select the Viz Tools tab in the Data Destination panel of the Tool Manager's main screen (Figure 4-4). From the popup list of tools, choose Statistics Visualizer.
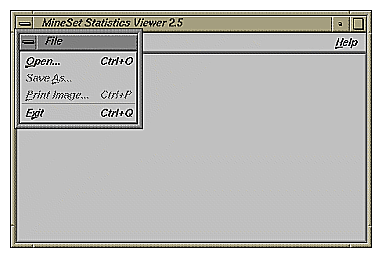
If you started the Statistics Visualizer from the icon, the main window shows the copyright notice and license agreement for the Statistics Visualizer. Only the File and Help pulldown menus can be used. For the main window to show all menus and controls, open a .statviz file. Use File > Open (Figure 4-3) to see a list of configuration files.
Three pulldown menus let you access additional Statistics Visualizer functions. These are labeled File, View, and Help. If you start the Statistics Visualizer without specifying a configuration file, only the File and the Help menus are available.
The File pulldown menu for the Statistics Visualizer contains four options.
Open loads and opens a file and displays it in the main window.
Save As saves the current state of the Statistics Visualizer main window into an image file
Print Image captures the image of outputs the current state of the Statistics Visualizer main window and prints it to a printer.
Exit closes all windows and exits the application
The Statistics Visualizer View pulldown menu (Figure 4-5) contains two options.
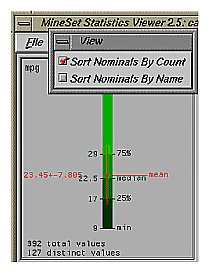
Sort Nominals By Count specifies that the nominal (discrete) columns show the histogram of values that is ordered by decreasing per-value counts.
Sort Nominals By Name specifies that those same columns be ordered by the relative alphabetical order of each data value name.
The Help menu provides access to five help functions (see Figure 4-6).
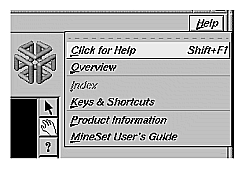
Click for Help turns the cursor into a question mark. Placing this cursor over an object in the Statistics Visualizer's main window and clicking the mouse causes a help screen to appear; this screen contains information about that object. Closing the help window restores the cursor to its arrow form and deselects the help function. The keyboard shortcut for this function is Shift+F1. (Note that it also is possible to place the arrow cursor over an object and press the F1 function key to access a help screen about that object.)
Overview provides a brief summary of the major functions of this tool, including how to open a file and how to interact with the resulting view.
Index provides an index of the complete help system. This option is currently disabled.
Keys & Shortcuts provides the keyboard shortcuts for all of the Statistics Visualizer's functions that have accelerator keys.
Product Information brings up a screen with the version number and copyright notice for the Statistics Visualizer.
MineSet User's Guide invokes the Insight viewer with the online version of this manual.