The main purpose of monitoring OpenGL Multipipe performance is to find bottlenecks. OpenGL Multipipe provides the following two tools for this purpose:
The ompmon tool is specific to OpenGL Multipipe and the applications running in its domain. The OpenGL Multipipe Performance Metric Domain Agent (PMDA) collects data that can be viewed in the Performance Co-Pilot environment along with other system-wide data (for example, CPU utilization, memory allocation, I/O operations, etc.).
This chapter describes these two tools. Once you identify performance bottlenecks, see Chapter 5, “Optimizing Performance”.
Limitations:
With both monitoring tools, the two following limitations apply:
Performance monitoring only applies to double-buffer applications since most performance metrics are averaged on a per-frame basis and a frame is defined to be the end of a glXSwapBuffers() call.
Vertices drawn using vertex buffer objects (VBOs) or vertex array objects (VAOs) are not counted either in retained mode or immediate mode.
The ompmon monitoring tool allows you to monitor OpenGL Multipipe performance and various other aspects of the applications running under OpenGL Multipipe. This section describes this tool using the following topics:
You invoke the graphical viewer using the ompmon command. By default, the viewer connects to and monitors the server specified by the DISPLAY environment variable. If you want the viewer displayed on a server different from the one where OpenGL Multipipe is running, you can use the -s option to specify the OpenGL Multipipe server to monitor. For example, the following entry specifies amstel:0 to be the ompmon display and keg:1 to be the OpenGL Multipipe display server:
keg % env DISPLAY=amstel:0 ompmon -s :1 |
As shown in Figure 4-1, the ompmon screen has the following two main sections:
Active Applications selection box (right side of the window)
Application information (left side of the window)
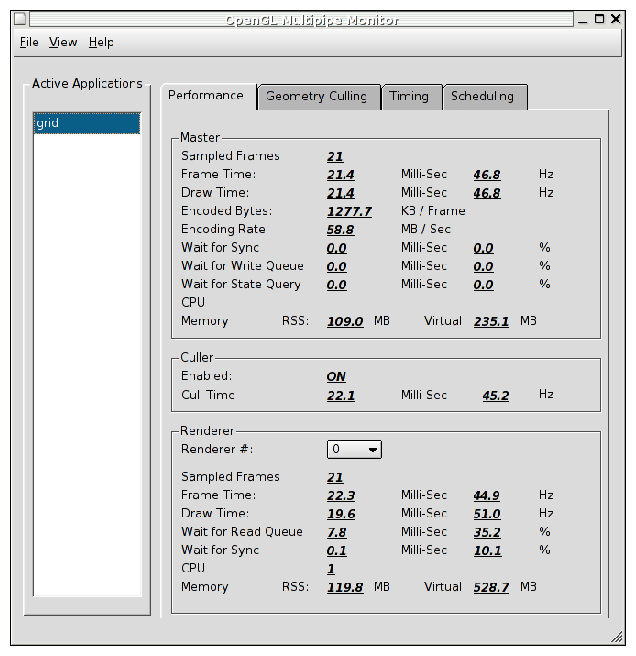
The Active Applications selection box lists the applications currently running under OpenGL Multipipe. Use this box to select the application you want to monitor.
 | Note: ompmon monitors each thread that makes OpenGL calls. Therefore, an application that has multiple rendering threads will have multiple entries in the list so that you can select the appropriate thread. |
As shown in Figure 4-1, the Performance tab provides an overview of the application's performance under OpenGL Multipipe. The performance data is divided into the following three groups:
Master data
Culler data
Renderer data
The various metrics are averaged across the number of frames as displayed in the Sampled Frames field. In a case where the application has not generated a new frame during the last sampling period, the data displayed by ompmon will not be updated and will be displayed in red.
The OpenGL Multipipe master is the layer in OpenGL Multipipe that runs as part of the application. Its purpose is to intercept the application's OpenGL calls, encode them, and send them via shared memory to the renderers (slaves) for display. Table 4-1 describes the data collected for the master.
Table 4-1. Metrics for the OpenGL Multipipe Master
The culler process scans the encoded stream generated by the master and attaches culling information to it for future culling by the renderers (slaves). Table 4-2 describes the data collected for the culler.
Table 4-2. Metrics for the Culler Process
Metric | Description |
|---|---|
Enabled | ON if cull is enabled for this application. |
Cull Time | Time between successive glXSwapBuffers() calls spent by the culler. Note that since the master and the culler process are inherently synchronized, the value for this metric should be close to the application's frame time. High values for the culler draw time might indicate a culling bottleneck; in this case, you should consider turning culling off. |
The renderers (slaves) are processes that receive the data encoded by the master and generates OpenGL calls to the graphics pipes. The number of the renderers running (as part of the an application) is determined by the number of pipes in the system and the OMP* activeScreens resource.
Table 4-3 describes the data collected for the renderers. You can select the renderer of interest from the Renderer # drop-down menu.
Table 4-3. Metrics for the Renderers
Metric | Description |
|---|---|
Sampled Frames | Number of frames sampled during the last sampling period. See Table 4-1 for more details. |
Frame Time | Frame time and period executed by the renderer. Frame time is defined to be the period between successive calls to glXSwapBuffers(). |
Draw Time | Draw time, expressed in milliseconds as well as in frames per second, is defined to be the period between a call to glClear() and a call to glXSwapBuffers(). |
Wait for Read Queue | Time (and percentage of the total frame time) spent by the renderer waiting for encoded data to become available for rendering. A high value for this metric indicates that the system bottleneck is on the encoding side. In such a case, optimization of the application (master) should be considered. Such optimization could be achieved either by allocating more resources to the application or optimizing the application directly. See Chapter 5, “Optimizing Performance” for details. |
Wait for Sync | Time (and percentage of the total frame time) spent by the renderer waiting for synchronization. The time includes the following: - Time waiting for the other renderers unless OMP*swapSyncMode is set to none. - In time-based decomposition sessions, time waiting its turn to show the rendered frame. In this mode, several frames may be rendered in parallel by different slaves and one slave may completely render its frame before its turn and must wait for all previous frames to be displayed before it displays its frame. - In time-based decomposition mode, time waiting for other applications as well to reach their swap points as all double-buffer applications on such sessions share the same swap group. A high value for this metric might indicate either that one of the other slaves is slower or a wait for other applications if using the time-based decomposition mode. |
CPU | CPU where the renderer process last exectued. |
Memory | Resident and virtual memory footprint of the renderer. |
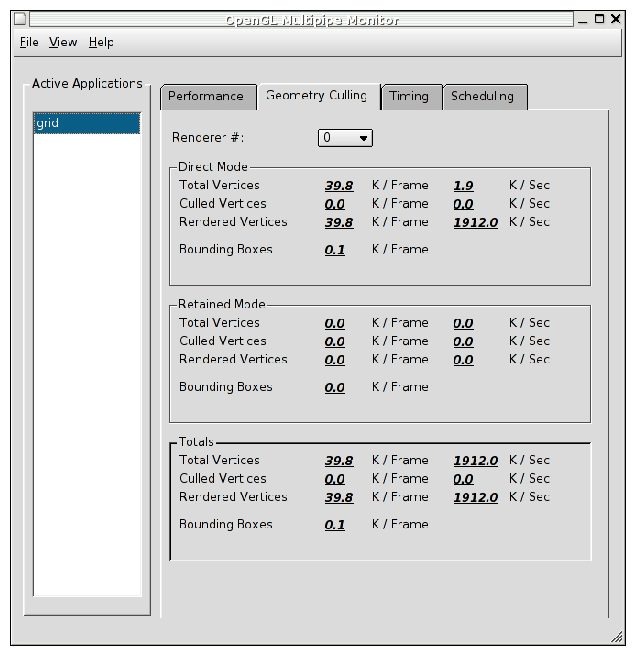
The Geometry Culling tab provides information about the geometry generated by the application and its culling statistics (that is, the amount of geometry eventually sent to each pipe). The Geometry Culling tab is only enabled if culling is enabled for the selected application. As shown in Figure 4-2, the statistics about the geometry sent to the renderer you select fall into the following three categories:
| Category | Description | |
| Direct Mode | Vertices processed by the pipe in direct mode | |
| Retained Mode | Vertices processed by the pipe as part of an OpenGL display list | |
| Totals | Total number of vertices processed by a pipe |
Table 4-4 describes the metrics displayed for each of these categories.
Table 4-4. Geometry Cullling Metrics
Metric | Description |
|---|---|
Total Vertices | Total number of vertices processed. |
Culled Vertices | Number of vertices that were culled out. |
Rendered Vertices | Number of vertices that were eventually rendered. |
Bounding Boxes | Number of bounding boxes that were used to spatially sort the vertices. Note that there is a trade-off between the number of vertices (controlled using the culling configuration resources of OpenGL Multipipe) and the total performance. On one hand, a high number of bounding boxes increases the culling overhead. On the other hand, a low number of bounding boxes makes the culling less accurate and unnecessary vertices will be sent down to the pipe for rendering. |
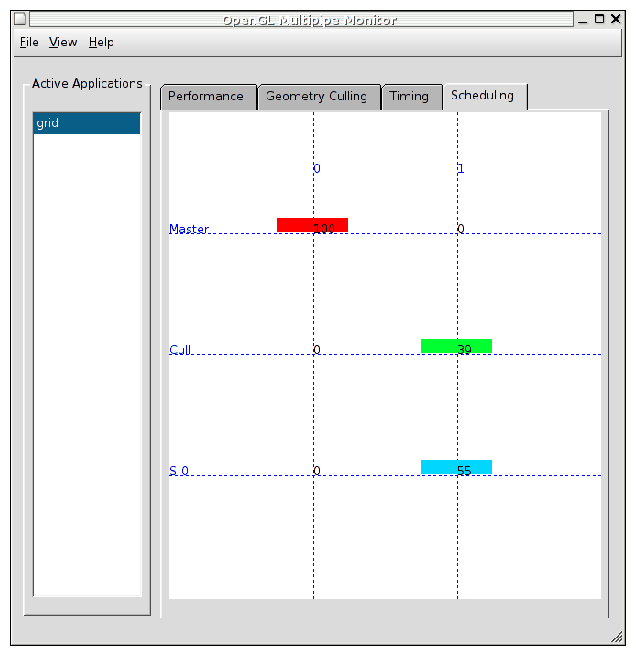
As shown in Figure 4-3, the Scheduling tab contains a chart with color-coded blocks to indicate which CPU is used by each OpenGL Multipipe process and the percentage of CPU time used by this process. The CPU usage is color-coded starting from yellow for low CPU usage through green and blue for medium usage up to magenta and red for high CPU usage.
| Note: Processes that consume less the 5% of a CPU's time are not displayed. |
For optimum performance, allocate each process with its own CPU. However, this requirement should be optimized according to the application's actual needs and the total amount of resources available in the system. The CPU used by each OpenGL Multipipe process can be controlled using the resource OMP* slaveCpus (see Chapter 3, “Using OpenGL Multipipe” for details).
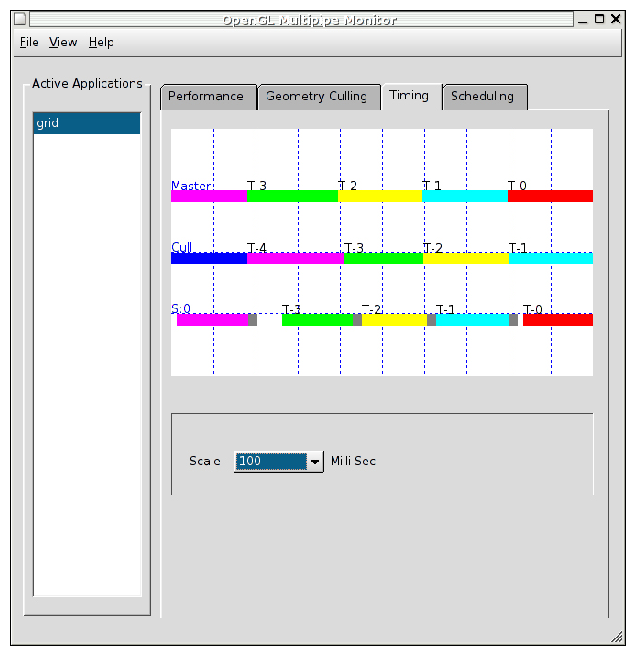
As shown in Figure 4-4, the Timing tab provides a timing chart that shows the parallelism of the OpenGL Multipipe pipeline. Each frame processed by OpenGL Multipipe is color-coded and marked with a label T-n, where n is the number of the frame prior to the last processed frame. In order to avoid display cluttering, the timing labels are not displayed if the processing time becomes small relative to the current display scale. Synchronization time is marked in gray and indicates that a process has completed its current frame and is waiting for synchronization before proceeding to the next frame. The time scale for the timing chart is controlled using the Scale drop-down menu. If the timing chart becomes “jumpy” and unreadable, you can pause the data collection of ompmon as described in the next section “Miscellaneous Controls”.
In addition to selecting the application (or application thread) to monitor and the type of performance information to view using the tabs, you can also control other aspects of ompmon behavior—for example, pausing the display, controlling the frequency with which ompmon refreshes the application list, and controlling the reporting periods. Table 4-5 describes these miscellaneous controls.
Table 4-5. Miscellaneous ompmon Controls
Behavior | Description | Control |
|---|---|---|
Data collection frequency | How often should ompmon sample the OpenGL Multipipe performance events queue. If the value for this period is too high, you lose performance data and, consequently, get inaccurate performance readings. If this value is too low, you get a heavy load on the ompmon process. A reasonable value should be in the range of 3 to 5 times the frame rate of the selected application. | File -> Preferences dialog from the menu bar |
Data collection pause | ompmon collects no new data and displays a (Paused) string in its window frame. | View -> Pause from the menu bar. Toggle the Pause selection to resume data collection. |
Reporting period | The period over which ompmon is to collect and report statistics. The value of this period should allow enough time to collect statistics and make the display stable and consistent. A reasonable value should be approximately 10 times the frame rate of the selected application. | File -> Preferences dialog from the menu bar |
Check for new applications | How often to refresh the OpenGL Multipipe application list to account for new and exited applications. | File -> Preferences dialog from the menu bar |
The OpenGL Multipipe PMDA for Performance Co-Pilot collects the performance data from OpenGL Multipipe and makes it available for the various performance metrics viewers available with Performance Co-Pilot. For example, you can use the Performance Co-Pilot graphical viewer pmchart to display OpenGL Multipipe metrics. For the details about using the Performance Co-Pilot tool suite, see Performance Co-Pilot for IA-64 Linux User's and Administrator's Guide.
The OpenGL Multipipe PMDA installation is described in Chapter 2, “Installing OpenGL Multipipe”. The description of the OMP command can be obtained using the following command:
% pminfo -t |
Table 4-6 and Table 4-7 describe the metrics that the OpenGL Multipipe PMDA provides for PCP.
Table 4-6. PMDA Metrics for the OpenGL Multipipe Master
Metric | Description |
|---|---|
multipipe.master.nframes | Number of frames processed in the statistics period |
multipipe.master.frame_time | Time elapsed between two successive glXSwapBuffers() calls |
multipipe.master.frame_rate | Number of glXSwapBuffers() calls per second |
multipipe.master.draw_time | Time elapsed between glClear() to glXSwapBuffers() calls |
multipipe.master.draw_rate | 1.0/draw_time value |
multipipe.master.encoded_bytes | Number of encoded bytes per frame |
multipipe.master.encoding_rate | Encoding rate of the OpenGL Multipipe master |
multipipe.master.wait_write_queue | Amount of time spent by the encoder waiting for the write queue to drain |
multipipe.master.wait_write_queue_p | Portion of the frame time spent by the encoder waiting for the write queue to drain |
multipipe.master.wait_state_query | Amount of time spent by the encoder waiting for state queries on the graphics pipes |
multipipe.master.wait_state_query_p | Portion of the frame time the encoder was waiting for state queries on the graphics pipes |
multipipe.master.wait_EOF_sync | Time spent by the master waiting for end-of-frame synchronization |
multipipe.master.wait_EOF_p | Portion of the frame time the encoder was waiting for end-of-frame synchronization |
Table 4-7. PMDA Metrics for the OpenGL Multipipe Slaves
Metric | Description |
|---|---|
multipipe.slaveN.nframes | Number of frames processed in the statistics period |
multipipe.slaveN.frame_time | Time elapsed between two successive glXSwapBuffers() calls |
multipipe.slaveN.frame_rate | Number of glXSwapBuffers() calls per second |
multipipe.slaveN.draw_time | Time elapsed between glClear() to glXSwapBuffers() calls |
multipipe.slaveN.draw_rate | 1.0/draw_time value |
multipipe.slaveN.wait_read_queue | Amount of time the renderer was waiting for data to render |
multipipe.slaveN.wait_read_queue_p | Portion of the frame time the renderer was waiting for new data to render |
multipipe.slaveN.wait_sync | Amount of time the renderer to sync with other renderers |
multipipe.slaveN.wait_sync_p | Portion of frame that the renderer was waiting to sync with other renderers |
multipipe.slaveN.direct_vertices | Number of vertices generated by the application in direct mode |
multipipe.slaveN.direct_vertices_rate | Rate the application sends vertices in direct mode |
multipipe.slaveN.direct_culled_vertices | Number of vertices sent by the application in direct mode that were culled out |
multipipe.slaveN.direct_culled_vertices_rate | Culling rate of vertices sent by the application in direct mode |
multipipe.slaveN.direct_rendered_vertices | Vertices rendered in direct mode |
multipipe.slaveN.direct_rendered_vertices_rate | Vertex rendering rate in direct mode |
multipipe.slaveN.direct_bbox_cmd | Number of bounding boxes tests for vertices in direct mode |
multipipe.slaveN.retained_vertices | Number of vertices sent by the appliation in retained mode |
multipipe.slaveN.retained_vertices_rate | Rate of vertices sent by the application in retained mode |
modemultipipe.slaveN.retained_culled_vertices | Number of retained-mode vertices that were culled out |
multipipe.slaveN.retained_culled_vertices_rate | Culling rate of retained-mode vertices |
multipipe.slaveN.retained_rendered_vertices | Vertices rendered in retained mode |
multipipe.slaveN.retained_rendered_vertices_rate | Retained-Mode vertex rendering rate |
multipipe.slaveN.retained_bbox_cmd | Retained-Mode bounding box commands |
multipipe.slaveN.total_vertices | Total number of vertices sent by the application |
multipipe.slaveN.total_vertices_rate | Total rate that the application is generating new vertices |
multipipe.slaveN.total_culled_vertices | Total number of vertices that were culled out by OpenGL Multipipe |
multipipe.slaveN.total_culled_vertices_rate | Total culling rate of vertices that were sent by the application |
multipipe.slaveN.total_rendered_vertices | Total rendered vertices |
multipipe.slaveN.total_rendered_vertices_rate | Total vertices rendering rate |
multipipe.slaveN.total_bbox_cmd | Total number of bounding box commands generated by OpenGL Multipipe |