Performance Co-Pilot (PCP) is an integrated suite of system-level performance monitoring tools. PCP provides a unifying abstraction for all of the interesting performance data in a system or cluster of systems, and allows client applications to easily retrieve and process any subset of that data using a single API. A client-server architecture allows multiple clients to monitor the same host, and a single client to monitor multiple hosts, such as those in a cluster. This enables centralized monitoring of distributed processing jobs across the cluster.
The PCP tools shipped with ACE include the Performance Monitoring Collection Daemon (pmcd), several of its optional agents, and a powerful suite of 2D and 3D visualization tools. The optional post-install configuration steps for PCP and the cluster visualization tools provided with PCP are discussed in the following sections.
This chapter discusses the following:
When you install the PCP product, the pcp, pcp-ace, and pcp-pro packages are installed on each node, including the head node. Some sites may have security policies that use the head node as a firewall for controlling access to the execution nodes and therefore not allow direct socket connections from outside the cluster. You can still use PCP tools such as clustervis, pmgcluster, and pmchart in this scenario by remotely logging in to the head node and displaying the monitoring information back to your remote workstation, as shown in Figure 10-1. See the /usr/doc/pcp-pro-Version/README file for other possibilities.
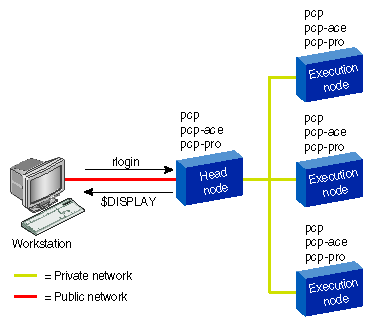
The pcp-ace and pcp-pro packages on the head node require that the pcp collector daemon is running on each execution node; once the pcp RPM is installed, the pcp collector daemon will start automatically on each reboot.
 | Note: The installace utility automatically starts PCP. However, to manually start PCP, enter the following:
|
However, if you have public network access to the execution nodes, you may want to install the pcp, pcp-ace, and pcp-pro packages on a workstation that is not part of the cluster. Doing so will result in better performance, especially if the workstation has hardware-accelerated graphics. Figure 10-2 shows this topology.
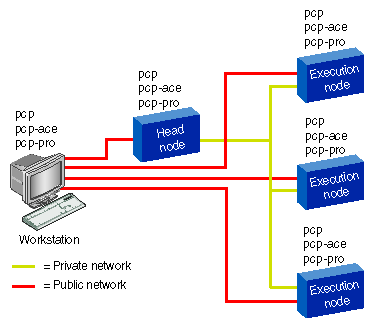
To install the required packages on a Linux workstation, do the following:
Log into the workstation as root.
Insert the Linux ACE CD-ROM in the workstation's driver.
Mount the CD-ROM by entering the following:
# /bin/mount /dev/cdrom /mnt/cdrom
Change to the /mnt/cdrom directory:
# cd /mnt/cdrom
Enter the following to install the packages (line break added here for readability):
# rpm -i RPM/pcp*.i386.rpm \
RPM/pcp-pro*.i386.rpm RPM/pcp-ace*.i386.rpm
The /etc/ace/nodes file is used by the PCP monitor tools to identify the hostname of all nodes in the cluster. This file would normally already exist on the head node, but if the PCP tools are installed on a workstation other than the head node, you may need to configure the file manually (such as by copying it from the head node). By default, the pmgcluster tool (2D display) and the clustervis tool (3D display) will display performance data for all hosts named in this file. See the clustervis(1)and pmgcluster(1) manual pages for more information.
The PCP monitoring tools that use a 3D display (mpivis, dkvis, osvis, clustervis, webvis and weblogvis) will work best if there is a 16 bpp or better visual available. An 8-bpp visual will still work, but some annoying colormap flashing may occur. You can use the xdpyinfo tool to determine what visuals are available.
Most X servers can be run with the -bbp 16 option; see the Xserver(1)man page for details. The default is usually 8 bpp.
The clustervis(1), mpivis(1), and pmgcluster(1) tools are the most common starting point for monitoring ACE clusters with PCP. When using clustervis or mpivis, you can click on blocks or base planes in the scene and then select another tool via the Launch menu to zoom in on interesting items of cluster/system activity.
The pmgcluster and pmgsys tools are designed to provide an overview of cluster/system activity in a very compact window. To monitor the fine-level performance details on a particular host, use the pmchart(1) tool.
Another important feature of the PCP visualization tools is their ability to "record" and then later "play back" the performance data. This allows retrospective analysis of the performance characteristics of activity across the cluster and is often the only effective way to tune distributed applications. The easiest way to use this facility is to use the File/Record menu option in clustervis(1), mpivis(1), or pmchart(1) and the use the pmafm(1) tool to replay the resulting archives. You can also use the pmlogger(1) tool to create customized archives if necessary.
| Note: The pmgadgets(1) tool and its front-end tools(pmgcluster, pmgsys, and others) cannot record or play back archives. |
The mpivis(1) tool, and its associated agent pmdampi(1), provide a powerful way to monitor distributed MPI jobs.
Figure 10-3 shows an example mpivis display. This example shows a five-node cluster with nine CPUs in total. Nodes 01, 02 and 03 have MPI ranks that are blocked in barrier wait, while nodes 00 and 03 each have a rank sending and node 04 has both its ranks receiving. Clearly, the receiving ranks on node 04 may represent a bottleneck.
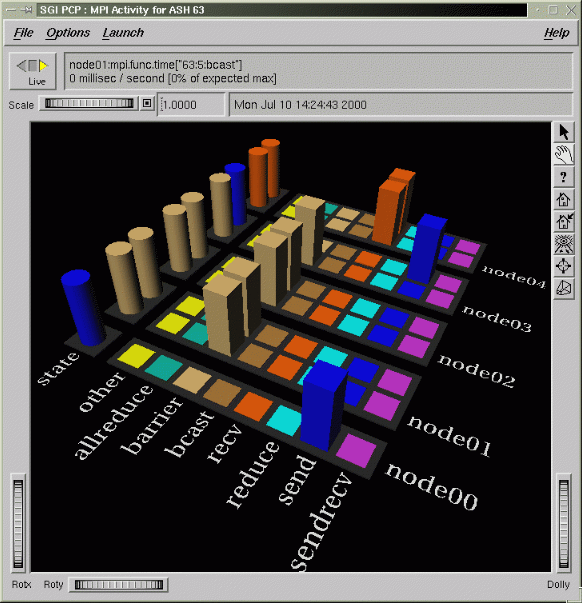
To enable this facility, you must configure the PCP MPI agent on every execution node in the cluster. You must also relink your MPI applications with libpcp_mpi, which is an instrumented wrapper library for the MPI library. The libpcp_mpi library has been engineered to impose very little overhead and can thus be used without significant performance degradation. For detailed installation and configuration procedures, see the /var/pcp/pmdas/mpi/README file. The pmfindash(1) utility is also extremely useful when using mpivis(1), especially on a shared cluster where multiple users may be running jobs simultaneously.
PCP includes an optional agent and visualization tool to monitor Myrinet switch traffic (on 16-port switches only). This is also described in “Monitoring Myrinet Packet Traffic” in Chapter 6. For detailed instruction, see the pmdamyrinet(1) and myrinetmon(1) man pages and in the /var/pcp/pmdas/myrinet/README file.
PCP includes an optional agent that can extract traffic statistics from Cisco switches and routers. To enable this facility, follow the instructions in the /var/pcp/pmdas/cisco/README file and in the pmdacisco(1) and pmgcisco(1) man pages.
When configuring pmdacisco(1), you will be asked several questions, including the host name of the Cisco hardware and which ports you want to monitor. Once you have the Cisco agent configured, you can use the pmgcisco tool on any node (usually the head node) to monitor the Cisco hardware. If you are running pmgcisco on a host other than the host running the Cisco agent, you must use the -h host option with pmgcisco. The host given with the -h option should be the host name of the host running the Cisco agent (not the hostname of the Cisco hardware itself).
PCP provides a thread-safe API for allowing your C/C++, Fortran or Java application to export performance data into the PCP framework. The pmdatrace(1) optional agent is used to collect this information and the pmchart(1) tool is generally used to monitor applications instrumented in this way. See the /var/pcp/pmdas/trace/README file for further instructions. There is also the pmtrace(1)command for permitting scripted applications.
The pmchart(1) tool can also be used to monitor specific processes running on the cluster. Users should should start their application on one or more nodes across the cluster, and then use pmchart to create charts showing one or more of the proc metrics. The File/NewPlot menu choice opens the Metric Selection Dialog, from which you can navigate to the desired metrics. Once a metric has been selected (in the right hand list box), you can use the info button to display descriptive text for that metric. Some useful proc metrics include the following:
proc.psinfo.stime -- system (kernel) CPU time for the process
proc.psinfo.cstime -- system (kernel) CPU time for the process & all children
proc.psinfo.utime -- user mode CPU time for the process
proc.psinfo.cutime -- user mode CPU time for the process & all children
proc.memory.* -- memory usage (virtual size, resident size, etc)
proc.psinfo.maj_flt -- major page faults
All of the PCP 3D tools are in fact front-end scripts that generate input for the pmview(1) application. As such, it is usually fairly simple to construct a custom visualization tool. See the pmview(1) man page for a description of the scene-configuration language. Likewise, tools such as pmgcluster, pmgsys, pmgcisco and others are front-end scripts for pmgadgets(1). In both cases, the -V command line option may be used with a front-end script to print the configuration file before it is fed to the back-end. The result is often a good starting point for a custom front-end tool.
The pmchart(1) tool allows "views" to be saved and customized. When monitoring multiple hosts, such as in a cluster, it is often useful to interactively create a desired set of charts, then use the File/Save menu option to save that configuration. You can reload a view with the -c command line option or via the File/OpenView menu choice. See the pmchart(1) man page for further information and a description of the view configuration syntax.
The PCPIntro(1) man page provides an overview of PCP and common command line options.
The pmcd, libraries, and API features of PCP are now available as Open Source software. See http://oss.sgi.com/projects/pcp
The Performance Co-Pilot User's and Administrator's Guideand the Performance Co-Pilot Programmer's Guide are available online from SGI's Tech Pubs Library. Search for the strings PCP_UAG and PCP_PG, respectfully.
Questions about PCP should be directed to the PCP Open Source mailing list at [email protected]. To join the mailing list, please use the link on the PCP home page (http://oss.sgi.com/projects/pcp).