This chapter provides an introduction to selection and drill-through. With these features, you can select graphical objects in the visual tools, show the data associated with that tool, and send your selection to the Tool Manager to view the original data or to analyze it using another tool.
These features are common to all tools in MineSet, although certain tools have additional behavioral characteristics. Tool-specific details are provided at the end of this chapter.
In most of the tools, selection is done using Shift-Mouse 1. Clicking mouse button 1 on an object without pressing Shift, selects the object under the cursor while deselecting all other previously selected objects. Holding down Shift while clicking mouse button 1 toggles the selection of that object without affecting any other selections. (Note that the Splat Visualizer has a different interface, described at the end of this chapter.)
When you select an item, a message describing that item appears in the tool's main window; by default, the visual tools only show information on the last object selected. A separate Record Viewer window displays a table, which shows the values for all selections. In the Tree and Map Visualizers, choose the Selection > Show Values to see this. Figure 18-1 shows an example of the selected values in the Record Viewer. See also “The Record Viewer” in Chapter 3.
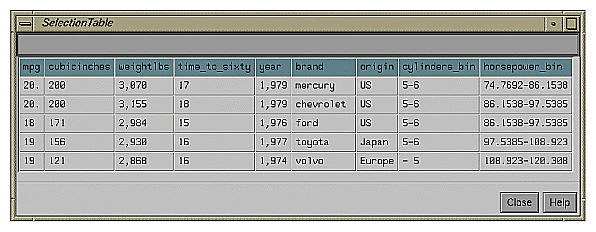
If a message has been set for the particular tool, that message also appears in the table. Columns in this table can be resized by dragging the separators between the columns. You also can click on a value to display the complete text of that value at the top of the table.
It is often useful to see or manipulate the original data from the data source that resulted in the current selections. This is referred to as drill-through. There are two entries on the Selections menu that perform drill-through:
Send to Tool Manager — When this is selected, the history of operations that produced the visualization is placed in the Tool Manager. A filter operation corresponding to the user's selection in the visual tool is added to the history. The filter is placed as early in the history as possible, given the restrictions described below.
Show Original Data — As with Send to Tool Manager, this option starts with the history of operations used to produce the visualization, and adds a filter operation as early as possible in the history. All non-filter operations coming after the filter in the history are removed. This new history is used to produce a table shown in the Record Viewer. If the filter can be placed at the beginning of the history, the data shown are the original records; otherwise, a warning is issued, indicating that the data are not totally original. The state of the Tool Manager is not altered (unless it is currently not running).
In either case, the Tool Manager performs the operation. If the Tool Manager is not running, it is started automatically.
Only visualizations generated using the Tool Manager can be used for drill-through. Each .schema file for these visualizations includes a history section that informs the Tool Manager how that file was generated. A few special-purpose mining visualizations such as Learning Curves, Confusion Matrices, Lift Curves, and the Rules Visualizer do not include a history and do not support drill-through.
When you select objects for drill-through, you are implicitly specifying a filter statement based on the visualized table. If the table was transformed before visualization, the Tool Manager might have to change the filter to place it earlier in the history. For example, if the filter is based on a binned column, the Tool Manager must change it so it refers to the pre-binned column.
The filter cannot always be placed at the beginning of the history because the Tool Manager cannot adjust the filter for all operations. Specifically, if the filter refers to any column created via Add Column, Aggregate, or Apply Model, the filter cannot be placed earlier in the history than the operation that created the column. Furthermore, the Tool Manager can never move a filter earlier than an existing Sample operation, since that would dramatically change the output of the sampling.
The Show Original Data mode tries to truncate the history to show the records from as early a stage as possible. To prevent this mode from showing more records than were selected, however, the truncation does not remove any other existing filter operations (either user-created or the result of previous drill-through).
The Tree Visualizer selects drill-through criteria based on the location in the hierarchy and, if appropriate, the bar selected on that node. For example, in a sales hierarchy with region, city, and store, and with bars representing products, selecting the furniture bar for a particular city can generate a drill-through request selecting everything for which region=Western and city=Mountain View and product=furniture.
In the Decision Tree, the drill-through request is based on the decision criteria. For example, for an automobile decision tree, a drill-through request might be:
“cubicinches <= 170 and mpg>20 and origin=US.” In both cases, selecting the top node of the tree generates a drill-through of the entire dataset. For both Decision Trees and normal hierarchies, selecting the top node of the tree generates a drill-through of the entire dataset.
Drill-through in the Map Visualizer is based on the regions selected.
The Scatter Visualizer uses a selection box in addition to Shift-select. From the Selection menu select Create Box Selection. The box has tabs that can be used to resize or move it. You can not create more than one box.
The Scatter Visualizer does not have a key with which to select columns used for drill-through. The default is to use all non-array columns that have been mapped to graphical requirements (such as axes, size, color and sliders). From the Selections pull-down menu, the Preferences panel lets you select an alternate list of columns to be used in the drill-through.
A Record Viewer appears whenever a selection has been made. It shows the current selections. If the Record Viewer is closed, the selections are cleared.
The Splat Visualizer uses a Selection box rather than Shift-click to select multiple objects. From the Selection menu select Create Box Selection. The box has tabs that can be used to resize it, or it can be moved. You can create more than one box.
The Record Viewer is tied to the Selection box; when the Record Viewer is dismissed, the selections are cleared. Drill-through is based on where the box is within the axes, and, optionally, on the sliders, if the Use Slider on Drill Thru item on the Selection menu is checked.