This introduction provides an overview of MineSet™, an integrated suite of database mining and visualization tools, and describes the basic tool execution scenario.
 | Note: Before using any of the MineSet tools, follow the installation and licensing instructions in the MineSet release notes. Then your system administrator must set up the DataMover configuration file. You also can choose to set up some options. The setup details are described in Chapter 2. |
The MineSet suite tools let you mine and graphically display quantitative information in ways that can help you better visualize, explore, and understand your data. This suite of data mining and analysis tools can help you organize and examine your data in new and meaningful ways. The mining tools automatically find patterns and build models that can be viewed using the visualization tools. Also, the visualization tools can be applied directly to the data for more insights. These tools provide an enabling power that lets you gain a deeper, intuitive understanding of your data, and helps you discover hidden patterns and important trends.
These tools provide a highly interactive, three-dimensional (3D) visual interface that lets you manipulate visual objects on the screen, as well as perform animations. This ability to visualize and survey complex data patterns can prove invaluable as a decision support mechanism.
The MineSet suite consists of three basic components:
a centralized control module, consisting of a graphical user interface tool called the Tool Manager, and a process called the DataMover, which runs on the server
database mining, with four database mining tools:
Association Rules Generator
Decision Tree Inducer and Classifier
Evidence Inducer and Classifier
Column Importance
visualization tools, of which there are five that let you view your data using different visual metaphors:
Tree Visualizer
Map Visualizer
Scatter Visualizer
Rules Visualizer
Evidence Visualizer
The following sections provide a brief description of each of the mentioned above components.
Each of the mining and visualization tools described below can be configured and started via a consistent graphical user interface known as the Tool Manager. The Tool Manager
connects you to the server on which the database and mining tools reside
lets you access, query, and manipulate data
creates configuration files for each tool
extracts data from the database to generate input files for each of the tools
The DataMover is a process that runs on the server on behalf of the user. The DataMover
connects to the database or flat files, and retrieves the data
invokes the mining tools
performs additional data manipulation such as binning and aggregation
returns the data to the Tool Manager for distribution to the visualization tools
can store the data in files on the server or client for future operations.
The Association Rules Generator part of this tool processes an input file, then generates an output file consisting of rules. These rules indicate the frequency with which one item occurs in a record along with another item. The strength of the association is quantified by three numbers.
The first number, the predictability of the rule, quantifies how often X and Y occur together as a fraction of the number of records in which X occurs. For example, given that someone has bought milk, how often do they also buy eggs.
The second number, the prevalence of the rule, quantifies how often X and Y occur together in the file as a fraction of the total number of records. For example, how often were milk and eggs bought together.
The third number is expected predictability. This gives an indication of what the predictability would be if there were no relationship between the items in the record. For example, how often were eggs bought, regardless of whether milk was bought as well.
The Decision Tree Classifier classifies data according to a set of attributes by making a series of decisions based on those attributes. The process is similar to using a biological key to identify plants. Applying this classifier to determine the profile of someone with credit worthiness, for example, a decision tree might determine if someone who owns a home, owns a car that cost between $15,000 and $23,000, and has two children, is a good credit risk.
The Decision Tree Inducer generates a decision tree classifier from a “training set” (a set of data that the user has already classified). Then, the structure of the classifier's decision tree is displayed using the Tree Visualizer, with each decision being represented by a node of the tree. The graphical representation can help the user understand the classification algorithm, as well as provide valuable insights into the data. Finally, the classifier can be used to classify unclassified data.
The Evidence Classifier classifies data by examining the probabilities of a specified result occurring based on a given attribute. For example, it might determine that someone who owns a car that cost between $15,000 and $23,000 has a 70% chance of being a good credit risk, and a 30% chance of being a bad credit risk. The classifier predicts the class with the highest probability based on a simple probabilistic model.
The classifier is first generated from a training set, similar to the decision tree classifier. The analysis of the data is displayed using the Evidence Visualizer, which shows pie charts illustrating the different probabilities. This graphical representation can help the user understand the classification algorithm, as well as providing valuable insights into the data and answering “what if” questions. Finally, the classifier can be used to classify unclassified data.
Column Importance determines how important various attributes are for determining the value of a given label attribute. For example, you can ask MineSet to select automatically the best three attributes that help determine whether someone is a good credit risk. The system might select income, own-house, and car-cost. These attributes then can be mapped to the axes of the Scatter Visualizer, or used in the hierarchy of the Tree Visualizer.
Column Importance has an advanced mode that provides additional capabilities. First, it lets you determine how important each of the attributes are. (For example, you could determine that both income and salary are similar in importance in determining credit risk. Although income might be slightly better in determining importance, perhaps you would prefer to use salary because it is easier to obtain.) Second, once you explicitly choose an attribute, you can determine what other attributes are important in conjunction with it. (For example, if you have chosen salary rather than income, house-cost might become more important than own-house, and income would have a very low importance.)
The Tree Visualizer helps you analyze data that has hierarchical relationships. It provides an interactive “fly-through” capability for examining the relations between data at different hierarchical levels. For example, the Tree Visualizer can be used to examine a company's product line, graphically displaying each product's contribution to the company's total revenue. Each branch of the hierarchy displays information at increasing levels of detail, breaking revenues down by product lines and, eventually, individual products. Another example of using the Tree Visualizer is to show company sales revenue, displaying a company-wide total as well as sub-totals at regional and other levels. The fly-through capability in the Tree Visualizer lets you rapidly reposition your view of the data. The Tree Visualizer's filtering and searching capabilities let you focus on specific data elements and queries.
The Tree Visualizer is also used to view the results of the Decision Tree Classifier, with each decision being represented by a separate node in the tree. Each node also shows bars showing how the classifier classifies the data based on the decisions up to that point (for example, 73% of people who own a home and have two children are good credit risks, while 27% are not).
The Map Visualizer lets you visualize data relationships that exist across geographically meaningful areas. For example, you can visualize different areas of a country, showing the relative impact of a marketing program. The Map Visualizer's drill-down capabilities let you focus on designated regions and perform a more detailed analysis in smaller geographical elements. One application might be analyzing how one or more products are being sold across different geographies. A powerful animation feature, coupled with a capability to connect different views of the same or related data, permits fast comparisons and difference analyses. This tool lets you visually examine patterns in your data that are difficult to detect when that data is shown in a tabular, two-dimensional form.
The Scatter Visualizer lets you examine the behavior of data across different dimensions. The data is shown in a grid representing up to three dimensions. Extra dimensions can map to the size, color, and label of each displayed entity. Two further independent dimensions can be assigned as dynamic dimensions. A slider can be use to select specific values along those dimensions, or a path can be traced through those dimensions, for animation. During the path traversal, the display changes automatically to reflect the change in the independent variable.
The Rules Visualizer visually represents the results of the Association Rules Generator mining tool. It provides detailed data analysis that lets you examine relationships across data elements in new ways. In doing so, you might discover relationships that significantly differ from what you might have expected; this, in turn, can lead to important discoveries about your data or the processes behind that data. This tool's visualization capabilities let you discover additional patterns of co-occurrence between these data elements. For example, you can use the analysis of products sold during the last sales promotion to guide your advertising campaign for the next sales period. The Rules Visualizer's high performance would let you analyze the results from today's sales data in time to alter the advertising campaign for the following day.
The Evidence Visualizer visually represents the results of the Evidence Classifier. It initially shows pie charts that represent how the various attributes contribute to the decision. For example, it might show that owning a home contributes to being a good credit risk. By clicking on the pie charts, one can show the effect of combining various attributes has on the final result; for example: what happens in a household that rents, has one child, and drives a car valued between $8,000 and $12,000.
Each of the MineSet tools is started, configured, and run in a consistent manner. The sequence of actions you follow at your workstation and at the host server is shown schematically in Figure 1-1. A description of the steps inherent in this figure follows.
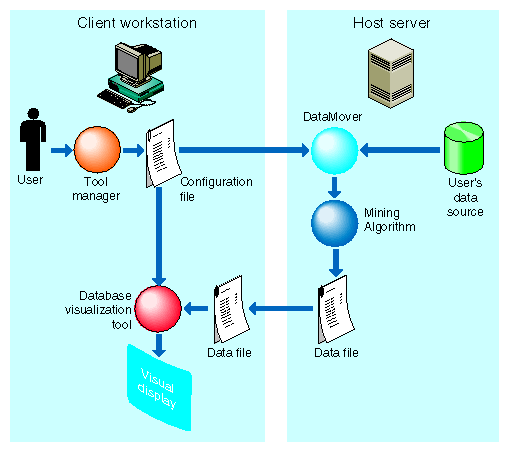
| Note: The following steps describe a “typical” interaction with a MineSet tool, and the sequence of the tool's actions. Depending on your requirements, some steps might be skipped (for instance, if the data and configuration files have been generated in a previous work session). |
Start the Tool Manager, which is the graphical interface for generating and specifying the configuration file, data file, and tools to be used. The Tool Manager resides on your workstation.
The Tool Manager opens a network connection to the DataMover, which runs on the server.
Use the Tool Manager to specify
the database and table, or a flat file containing the data on either the client or the server
which mining tools, if any, are to be applied
the data file to be generated
what tool visualizes the data
how that data is to be displayed
an optional file on the client or server in which to save the results for future processing
Information retrieved via the DataMover is used to guide this interaction. As a result, the Tool Manager generates a configuration file. This file contains the user-defined parameters that determine the execution of the following steps.
The Tool Manager transmits a copy of the configuration file from step 3 to the DataMover. The DataMover processes the file by
accessing the database or flat file
performing the specified data transformations
running the mining tools
generating the data file
This data file consists of your data in a specific format readable by the MineSet tool. Then a copy of the data file is placed on your workstation.
The Tool Manager invokes the MineSet visualization tool you specified in step 3.
The tool accesses the data file and, based on the user-defined parameters entered in step 3, graphically displays the data.
If you generated a classifier, that classifier can be applied to additional data (see Figure 8-5).