This chapter contains the following topics:
On symmetric multiprocessor (SMP) computers, all data is visible from all processors. Each processor is functionally identical and has equal time access to every memory address. That is, all processors have equally fast (symmetric) access to memory. These types of systems are easy to assemble but have limited scalability due to memory access times.
In contrast, a NUMA system has a shared address space, but the access time to memory varies over physical address ranges and between processing elements. Each processor has its own memory and can address the memory attached to another processor through the Quick Path Interconnect (QPI).
In both cases, there is a single shared memory space and a single operating system instance.
There are two levels of NUMA: intranode, managed by the Intel QPI, and internode, managed through the SGI HUB ASIC and SGI NUMAlink technology.
The following topics explain other aspects of the SGI NUMA computers:
Scalability is the measure of how the work done on a computing system changes as you add CPUs, memory, network bandwidth, I/O capacity, and other resources. Many factors, for example, memory latency across the system, can affect scalability.
In the SGI UV series systems, memory is physically distributed both within and among the IRU enclosures, which consist of the compute, memory, and I/O blades. However, memory is accessible to and shared by all devices, connected by NUMAlink, within the single-system image (SSI). In other words, all components connected by NUMAlink share a single Linux operating system, and they operate and share the memory fabric of the system. Memory latency is the amount of time required for a processor to retrieve data from memory. Memory latency is lowest when a processor accesses local memory.
The following are the terms used to refer to the types of memory within a system:
If a processor accesses memory that is on a compute node blade, that memory is referred to as the node's local memory .
If processors access memory located on other blade nodes within the IRU or within other NUMAlink IRUs, the memory is referred to as remote memory.
The total memory within the NUMAlink system is referred to as global memory.
As the name implies, the cache-coherent non-uniform memory access (ccNUMA) architecture has two parts, cache coherency and nonuniform memory access, which the following topics describe:
The SGI UV systems use caches to reduce memory latency. Although data exists in local or remote memory, copies of the data can exist in various processor caches throughout the system. Cache coherency keeps the cached copies consistent.
To keep the copies consistent, the ccNUMA architecture uses directory-based coherence protocol. In directory-based coherence protocol, each 64-byte block of memory has an entry in a table that is referred to as a directory. Like the blocks of memory that they represent, the directories are distributed among the compute and memory blade nodes. A block of memory is also referred to as a cache line.
Each directory entry indicates the state of the memory block that it represents. For example, when the block is not cached, it is in an unowned state. When only one processor has a copy of the memory block, it is in an exclusive state. When more than one processor has a copy of the block, it is in a shared state . A bit vector indicates the caches that may contain a copy.
When a processor modifies a block of data, the processors that have the same block of data in their caches must be notified of the modification. The SGI UV systems use an invalidation method to maintain cache coherence. The invalidation method purges all unmodified copies of the block of data, and the processor that wants to modify the block receives exclusive ownership of the block.
For cc-NUMA systems, like the SGI UV systems, performance degrades when the application accesses remote memory, versus local memory. Because the Linux operating system has a tendency to migrate processes, SGI recommends that you use the data and process placement tools.
Special optimization applies to SGI UV systems to exploit multiple paths to memory, as follows:
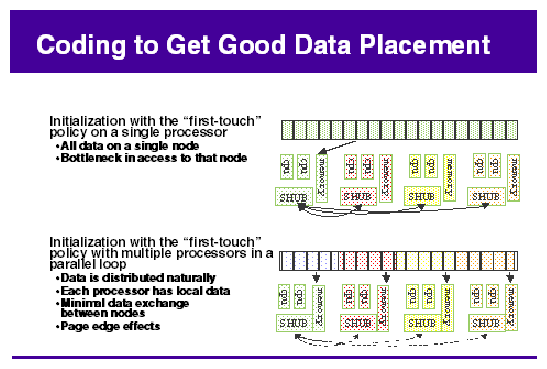
By default, all pages are allocated with a first touch policy.
The initialization loop, if executed serially, gets pages from single node.
Perform initialization in parallel, such that each processor initializes data that it is likely to access later for calculation.
In the parallel loop, multiple processors access that one memory page.
Figure 4-1, shows how to code to get good data placement.
The dplace(1) tool, the taskset(1) command, and the cpuset tools are built upon the cpusets API. These tools enable your applications to avoid poor data locality caused by process or thread drift from CPU to CPU. The omplace(1) tool works like the dplace(1) tool and is designed for use with OpenMP applications. The differences among these tools are as follows:
The taskset(1) command restricts execution to the listed set of CPUs when you specify the -c or --cpu-list option. The process is free to move among the CPUs that you specify.
The dplace(1) tool differs from taskset(1) in that dplace(1) binds processes to specified CPUs in round-robin fashion. After a process is pinned, it does not migrate, so you can use this for increasing the performance and reproducibility of parallel codes.
Cpusets are named subsets of system cpus/memories and are used extensively in batch environments. For more information about cpusets, see the SGI Cpuset Software Guide.
The following topics provide more information about the data and process placement utilities:
SGI systems support both cgroups and cpusets. The cpusets are a subsystem of cgroups.
For information about cpusets and cgroups, see the following:
The cpuset facility is a workload manager tool that permits a system administrator to restrict the number of processor and memory resources that a process or set of processes can use. A cpuset defines a list of CPUs and memory nodes. A process contained in a cpuset can execute only on the CPUs in that cpuset and can only allocate memory on the memory nodes in that cpuset. Essentially, a cpuset provides you with a CPU and a memory container or a soft partition within which you can run sets of related tasks. Using cpusets on an SGI UV system improves cache locality and memory access times and can substantially improve an application's performance and run-time repeatability.
Be aware that when placed in a cpuset, certain kernel threads can exhibit undesirable behavior. In general, kernel threads are not confined to a cpuset, but when a bootcpuset is created, all the kernel threads that are able to be placed in a cpuset become confined to the bootcpuset. In the case of the khugepaged daemon, this is undesirable because khugepaged becomes unable to allocate memory for processes that are on nodes outside of its cpuset. As a workaround, remove khugepaged from the bootcpuset after the machine is up and running. The following procedure explains how to implement the workaround.
Procedure 4-1. To remove khugepaged from the bootcpuset
Type the following command to retrieve the process ID of the khugepaged daemon:
ps -ef | grep khugepaged | grep -v grep
For example, in the following output, 1054 is the process ID:
# ps -ef | grep khugepaged | grep -v grep
root     1054     2  0 Mar04 ?      00:00:02 [khugepaged]
Use the echo(1) command, in the following format, to remove khugepaged from the bootcpuset:
echo khugepaged_pid > /dev/cpuset/tasks
For pid, specify the process ID for the khugepaged daemon.
(Optional) Script the preceding lines and run the script at boot time to ensure that the khugepaged thread is always removed from the bootcpuset.
For general information about cpusets, see the following:
SGI Cpuset Software Guide
https://www.kernel.org/doc/Documentation/cgroups/cpusets.txt
If you use cgroups, you can exert finer control over memory than is possible with cpusets. If you use cgroups, be aware that their use can result in a 1-5% memory overhead penalty. If you use a batch scheduler, verify that it supports cgroups before you configure cgroups.
For general information about cgroups, see the following:
https://www.kernel.org/doc/Documentation/cgroups/cgroups.txt
You can use the dplace(1) command to improve the performance of processes running on your SGI nonuniform memory access (NUMA) machine.
By default, memory is allocated to a process on the node on which the process is executing. If a process moves from node to node while it is running, a higher percentage of memory references are made to remote nodes. Because remote accesses typically have higher access times, performance can degrade. CPU instruction pipelines also have to be reloaded.
The dplace(1) command specifies scheduling and memory placement policies for the process. You can use the dplace command to bind a related set of processes to specific CPUs or nodes to prevent process migrations. In some cases, this improves performance because a higher percentage of memory accesses are made to local nodes.
Processes always execute within a cpuset. The cpuset specifies the CPUs on which a process can run. By default, processes usually execute in a cpuset that contains all the CPUs in the system. For information about cpusets, see the SGI Cpuset Software Guide.
The dplace(1) command creates a placement container that includes all the CPUs, or a subset of CPUs, of a cpuset. The dplace process is placed in this container and, by default, is bound to the first CPU of the cpuset associated with the container. Then dplace invokes exec to run the command.
The command runs within this placement container and remains bound to the first CPU of the container. As the command forks child processes, the child processes inherit the container and are bound to the next available CPU of the container.
If you do not specify a placement file, dplace binds processes sequentially in a round-robin fashion to CPUs of the placement container. For example, if the current cpuset consists of physical CPUs 2, 3, 8, and 9, the first process launched by dplace is bound to CPU 2. The first child process forked by this process is bound to CPU 3. The next process, regardless of whether it is forked by a parent or a child, is bound to CPU 8, and so on. If more processes are forked than there are CPUs in the cpuset, binding starts over with the first CPU in the cpuset.
For more information about dplace(1), see the dplace(1) man page. The dplace(1) man page also includes examples of how to use the command.
Example 4-1. Using the dplace(1) command with MPI Programs
The following command improves the placement of MPI programs on NUMA systems and verifies placement of certain data structures of a long-running MPI program:
% mpirun -np 64 /usr/bin/dplace -s1 -c 0-63 ./a.out |
The -s1 parameter causes dplace(1) to start placing processes with the second process, p1. The first process, p0, is not placed because it is associated with the job launch, not with the job itself. The -c 0-63 parameter causes dplace(1) to use processors 0-63.
You can then use the dlook(1) command to verify placement of the data structures in another window on one of the slave thread PIDs. For more information about the dlook command, see “dlook Command” and the dlook(1) man page.
Example 4-2. Using the dplace(1) command with OpenMP Programs
The following command runs an OpenMP program on logical CPUs 4 through 7 within the current cpuset:
% efc -o prog -openmp -O3 program.f % setenv OMP_NUM_THREADS 4 % dplace -c4-7 ./prog |
Example 4-3. Using the dplace (1) command with OpenMP Programs
The dplace(1) command has a static load balancing feature, so you do not have to supply a CPU list. To place prog1 on logical CPUs 0 through 3 and prog2 on logical CPUs 4 through 7, type the following:
% setenv OMP_NUM_THREADS 4 % dplace ./prog1 & % dplace ./prog2 & |
You can use the dplace -q command to display the static load information.
Example 4-4. Using the dplace(1) command with Linux commands
The following examples assume that you run the dplace commands from a shell that runs in a cpuset consisting of physical CPUs 8 through 15.
| Command | |
Run Location | |
| dplace -c2 date | |
Runs the date command on physical CPU 10. | |
| dplace make linux | |
Runs gcc and related processes on physical CPUs 8 through 15. | |
| dplace -c0-4,6 make linux | |
Runs gcc and related processes on physical CPUs 8 through 12 or 14. | |
| taskset 4,5,6,7 dplace app | |
The taskset command restricts execution to physical CPUs 12 through 15. The dplace command sequentially binds processes to CPUs 12 through 15. | |
Example 4-5. Using the dplace command and a debugger for verification
To use the dplace command accurately, you should know how your placed tasks are being created in terms of the fork, exec, and pthread_create calls. Determine whether each of these worker calls are an MPI rank task or are groups of pthreads created by rank tasks. Here is an example of two MPI ranks, each creating three threads:
cat <<EOF > placefile firsttask cpu=0 exec name=mpiapp cpu=1 fork name=mpiapp cpu=4-8:4 exact thread name=mpiapp oncpu=4 cpu=5-7 exact thread name=mpiapp oncpu=8 cpu=9-11 exact EOF # mpirun is placed on cpu 0 in this example # the root mpiapp is placed on cpu 1 in this example # or, if your version of dplace supports the "cpurel=" option: # firsttask cpu=0 # fork name=mpiapp cpu=4-8:4 exact # thread name=mpiapp oncpu=4 cpurel=1-3 exact # create 2 rank tasks, each will pthread_create 3 more # ranks will be on 4 and 8 # thread children on 5,6,7 9,10,11 dplace -p placefile mpirun -np 2 ~cpw/bin/mpiapp -P 3 -l exit |
You can use the debugger to determine if it is working. It should show two MPI rank applications, each with three pthreads, as follows:
>> pthreads | grep mpiapp
px *(task_struct *)e00002343c528000   17769   17769   17763  0       mpiapp
      member task: e000013817540000   17795   17769   17763  0     5 mpiapp
      member task: e000013473aa8000   17796   17769   17763  0     6 mpiapp
      member task: e000013817c68000   17798   17769   17763  0       mpiapp
px *(task_struct *)e0000234704f0000   17770   17770   17763  0       mpiapp
      member task: e000023466ed8000   17794   17770   17763  0     9 mpiapp
      member task: e00002384cce0000   17797   17770   17763  0       mpiapp
member task: e00002342c448000 17799 17770 17763 0 mpiapp |
You can also use the debugger to see a root application, the parent of the two MPI rank applications, as follows:
>> ps | grep mpiapp 0xe00000340b300000 1139 17763 17729 1 0xc800000 - mpiapp 0xe00002343c528000 1139 17769 17763 0 0xc800040 - mpiapp 0xe0000234704f0000 1139 17770 17763 0 0xc800040 8 mpiapp |
These are placed as specified:
>> oncpus e00002343c528000 e000013817540000 e000013473aa8000 >> e000013817c68000 e0 000234704f0000 e000023466ed8000 e00002384cce0000 e00002342c448000 task: 0xe00002343c528000 mpiapp cpus_allowed: 4 task: 0xe000013817540000 mpiapp cpus_allowed: 5 task: 0xe000013473aa8000 mpiapp cpus_allowed: 6 task: 0xe000013817c68000 mpiapp cpus_allowed: 7 task: 0xe0000234704f0000 mpiapp cpus_allowed: 8 task: 0xe000023466ed8000 mpiapp cpus_allowed: 9 task: 0xe00002384cce0000 mpiapp cpus_allowed: 10 task: 0xe00002342c448000 mpiapp cpus_allowed: 11 |
Example 4-6. Using the dplace (1) command for compute thread placement troubleshooting
Sometimes compute threads do not end up on unique processors when using commands such a dplace(1) or profile.pl. For information about Perfsuite, see the following:
“Profiling with PerfSuite” in Chapter 2
In this example, assume that the dplace -s1 -c0-15 command bound 16 processes to run on 0-15 CPUs. However, output from the top(1) command shows only 13 CPUs running with CPUs 13, 14, and 15 still idle, and CPUs 0, 1 and 2 are shared with 6 processes.
263 processes: 225 sleeping, 18 running, 3 zombie, 17 stopped
CPU states:  cpu    user    nice  system    irq  softirq  iowait    idle
             total  1265.6%    0.0%   28.8%   0.0%    11.2%    0.0%  291.2%

             cpu00  100.0%    0.0%    0.0%   0.0%     0.0%    0.0%    0.0%

             cpu01   90.1%    0.0%    0.0%   0.0%     9.7%    0.0%    0.0%

             cpu02   99.9%    0.0%    0.0%   0.0%     0.0%    0.0%    0.0%

             cpu03   99.9%    0.0%    0.0%   0.0%     0.0%    0.0%    0.0%

             cpu04  100.0%    0.0%    0.0%   0.0%     0.0%    0.0%    0.0%

             cpu05  100.0%    0.0%    0.0%   0.0%     0.0%    0.0%    0.0%

             cpu06  100.0%    0.0%    0.0%   0.0%     0.0%    0.0%    0.0%

             cpu07   88.4%    0.0%   10.6%   0.0%     0.8%    0.0%    0.0%

             cpu08  100.0%    0.0%    0.0%   0.0%     0.0%    0.0%    0.0%

             cpu09   99.9%    0.0%    0.0%   0.0%     0.0%    0.0%    0.0%

             cpu10   99.9%    0.0%    0.0%   0.0%     0.0%    0.0%    0.0%

             cpu11   88.1%    0.0%   11.2%   0.0%     0.6%    0.0%    0.0%

             cpu12   99.7%    0.0%    0.2%   0.0%     0.0%    0.0%    0.0%

             cpu13    0.0%    0.0%    2.5%   0.0%     0.0%    0.0%   97.4%

             cpu14    0.8%    0.0%    1.6%   0.0%     0.0%    0.0%   97.5%

             cpu15    0.0%    0.0%    2.4%   0.0%     0.0%    0.0%   97.5%
 Mem:  60134432k av, 15746912k used, 44387520k free,       0k shrd,
672k buff
         351024k active,            13594288k inactive

  Swap: 2559968k av,       0k used, 2559968k free
  2652128k cached

    PID USER     PRI  NI  SIZE  RSS SHARE STAT %CPU %MEM   TIME CPU COMMAND

   7653 ccao      25   0  115G 586M  114G R    99.9  0.9   0:08   3 mocassin

  7656 ccao      25   0  115G 586M  114G R    99.9  0.9   0:08   6 mocassin

   7654 ccao      25   0  115G 586M  114G R    99.8  0.9   0:08   4 mocassin

   7655 ccao      25   0  115G 586M  114G R    99.8  0.9   0:08   5 mocassin

   7658 ccao      25   0  115G 586M  114G R    99.8  0.9   0:08   8 mocassin

   7659 ccao      25   0  115G 586M  114G R    99.8  0.9   0:08   9 mocassin

   7660 ccao      25   0  115G 586M  114G R    99.8  0.9   0:08  10 mocassin

   7662 ccao      25   0  115G 586M  114G R    99.7  0.9   0:08  12 mocassin

   7657 ccao      25   0  115G 586M  114G R    88.5  0.9   0:07   7 mocassin

   7661 ccao      25   0  115G 586M  114G R    88.3  0.9   0:07  11 mocassin

   7649 ccao      25   0  115G 586M  114G R    55.2  0.9   0:04   2 mocassin

   7651 ccao      25   0  115G 586M  114G R    54.1  0.9   0:03   1 mocassin

   7650 ccao      25   0  115G 586M  114G R    50.0  0.9   0:04   0 mocassin

   7647 ccao      25   0  115G 586M  114G R    49.8  0.9   0:03   0 mocassin

   7652 ccao      25   0  115G 586M  114G R    44.7  0.9   0:04   2 mocassin

   7648 ccao      25   0  115G 586M  114G R    35.9  0.9   0:03   1 mocassin
|
Even if an application starts some threads executing for a very short time, the threads still have taken a token in the CPU list. Then, when the compute threads are finally started, the list is exhausted and restarts from the beginning. Consequently, some threads end up sharing the same CPU. To bypass this, try to eliminate the ghost thread creation, as follows:
Check for a call to the system function. This is often responsible for the placement failure due to unexpected thread creation. If all the compute processes have the same name, you can do this by issuing a command such as the following:
% dplace -c0-15 -n compute-process-name ...
You can also run dplace -e -c0-32 on 16 CPUs to understand the pattern of the thread creation. If this pattern is the same from one run to the other (unfortunately race between thread creation often occurs), you can find the right flag to dplace . For example, if you want to run on CPUs 0-3, with dplace -e -C0-16 and you see that threads are always placed on CPU 0, 1, 5, and 6, then one of the following commands should place your threads correctly:
dplace -e -c0,1,x,x,x,2,3
or
dplace -x24 -c0-3 # x24 =11000, place the 2 first and skip 3 before placing
The omplace(1) command controls the placement of MPI processes and OpenMP threads. This command is a wrapper script for dplace(1). Use omplace(1), rather than dplace(1), if your application uses MPI, OpenMP, pthreads, or hybrid MPI/OpenMP and MPI/pthreads codes. The omplace(1) command generates the proper dplace(1) placement file syntax automatically. It also supports some unique options, such as block-strided CPU lists.
The omplace(1) command causes the successive threads in a hybrid MPI/OpenMP job to be placed on unique CPUs. The CPUs are assigned in order from the effective CPU list within the containing cpuset. The CPU placement is performed by dynamically generating a placement file and invoking dplace(1) with the MPI job launch.
For example, to run two MPI processes with four threads per process, and to display the generated placement file, type a command similar to the following:
# mpirun -np 2 omplace -nt 4 -vv ./a.out |
The preceding command places the threads as follows:
rank 0 thread 0 on CPU 0 rank 0 thread 1 on CPU 1 rank 0 thread 2 on CPU 2 rank 0 thread 3 on CPU 3 rank 1 thread 0 on CPU 4 rank 1 thread 1 on CPU 5 rank 1 thread 2 on CPU 6 rank 1 thread 3 on CPU 7 |
For more information, see the omplace(1) man page and the SGI MPI and SGI SHMEM User Guide.
You can use the taskset(1) command to perform the following tasks:
Restricting execution to a list of CPUs. Use the -c parameter and the --cpu-list parameter.
Retrieving or setting the CPU affinity of a process. Use the following parameters:
taskset [options] mask command [arg]...
taskset [options] -p [mask] pid
Launching a new command with a specified CPU affinity.
CPU affinity is a scheduler property that bonds a process to a given set of CPUs on the system. The Linux scheduler honors the given CPU affinity and runs the process only on the specified CPUs. The process does not run on any other CPUs. Note that the scheduler also supports natural CPU affinity in which the scheduler attempts to keep processes on the same CPU as long as practical for performance reasons. Forcing a specific CPU affinity is useful only in certain applications.
The CPU affinity is represented as a bitmask, with the lowest order bit corresponding to the first logical CPU and the highest order bit corresponding to the last logical CPU. The mask parameter can specify more CPUs than are present. In other words, it might be true that not all CPUs specified in the mask exist on a given system. A retrieved mask reflects only the bits that correspond to CPUs physically on the system. If the mask does not correspond to any valid CPUs on the system, the mask is invalid, and the system returns an error. The masks are typically specified in hexadecimal notation. For example:
| mask specification | CPUs specified | |
| 0x00000001 | Processor #0 | |
| 0x00000003 | Processors #0 and #1 | |
| 0xFFFFFFFF | All processors (#0 through #31) |
When taskset(1) returns, it is guaranteed that the given program has been scheduled to a valid CPU.
The taskset(1) command does not pin a task to a specific CPU. Rather, it restricts a task so that it does not run on any CPU that is not in the CPU list. For example, if you use taskset(1) to launch an application that forks multiple tasks, it is possible that the scheduler initially assigns multiple tasks to the same CPU, even though there are idle CPUs that are in the CPU list. Scheduler load balancing software eventually distributes the tasks so that CPU-bound tasks run on different CPUs. However, the exact placement is not predictable and can vary from run to run. After the tasks are evenly distributed, a task can jump to a different CPU. This outcome can affect memory latency as pages that were node-local before the jump can be remote after the jump.
If you are running an MPI application, SGI recommends that you do not use the taskset(1) command because the taskset(1) command can pin the MPI shepherd process, which wastes a CPU, and then put the remaining working MPI rank on one of the CPUs that already had some other rank running on it. Instead of taskset(1), SGI recommends that you use the dplace(1) command or the environment variable MPI_DSM_CPULIST. For more information, see “dplace Command”.
If you are using a batch scheduler that creates and destroys cpusets dynamically, SGI recommends that you use the MPI_DSM_DISTRIBUTE environment variable instead of either the MPI_DSM_CPULIST environment variable or the dplace (1) command.
Example 1. The following example shows how to run an MPI program on eight CPUs:
# mpirun -np 8 dplace -s1 -c10,11,16-21 myMPIapplication ... |
Example 2. The following example sets the MPI_DSM_CPULIST variable:
# setenv MPI_DSM_CPULIST 10,11,16-21 mpirun -np 8 myMPIapplication ... |
Example 3. The following example runs an executable on CPU 1. The mask for CPU 1 is 0x2, so type the following:
# taskset 0x2 executable_name |
Example 4. The following example moves PID 14057 to CPU 0. The mask for CPU 0 is 0x1, so type the following:
# taskset -p 0x1 14057 |
Example 5. The following example runs an MPI Abaqus/Standard job on an SGI UV system with eight CPUs. Standard input is redirected to /dev/null to avoid a SIGTTIN signal for MPT applications. Type the following:
# taskset -c 8-15 ./runme < /dev/null & |
Example 6. The following example uses the taskset(1) command to lock a given process to a particular CPU, CPU5, and then uses the profile(1) command to profile it. The second command moves the process to another CPU, CPU3. Type the following:
# taskset -p -c 5 16269 pid 16269's current affinity list: 0-15 pid 16269's new affinity list: 5 # taskset -p 16269 -c 3 pid 16269's current affinity list: 5 pid 16269's new affinity list: 3 |
For more information, see the taskset(1) man page.
The numactl(8) command runs processes with a specific NUMA scheduling or memory placement policy. The policy is set for an executable command and inherited by all of its children. In addition, numactl(8) can set a persistent policy for shared memory segments or files. For more information, see the numactl(8) man page.
You can use the dlook (1) command to find out where, in memory, the operating system is placing your application's pages and how much system and user CPU time it is consuming. The command allows you to display the memory map and CPU usage for a specified process. For each page in the virtual address space of the process, dlook(1) generates the following information:
The object that owns the page, such as a file, SYSV shared memory, a device driver, and so on.
The type of page, such as random access memory (RAM), FETCHOP, IOSPACE, and so on.
If the page type is RAM memory, the following information is displayed:
Memory attributes, such as, SHARED, DIRTY, and so on
The node on which the page is located
The physical address of the page (optional)
Example 4-7. Using dlook(1) with a PID
To specify a PID as a parameter to the dlook(1) command, you must be the owner of the process, or you must be logged in as the root user. The following dlook(1) command example shows output for the sleep process, with a PID of 191155:
$ dlook 191155 _______________________________________________________________________________ Peek: sleep Pid: 191155 Fri Sep 27 17:14:01 2013 Process memory map: 00400000-00406000 r-xp 00000000 08:08 262250 /bin/sleep [0000000000400000-0000000000401000] 1 page on node 4 MEMORY|SHARED [0000000000401000-0000000000402000] 1 page on node 5 MEMORY|SHARED [0000000000403000-0000000000404000] 1 page on node 7 MEMORY|SHARED [0000000000404000-0000000000405000] 1 page on node 8 MEMORY|SHARED 00605000-00606000 rw-p 00005000 08:08 262250 /bin/sleep [0000000000605000-0000000000606000] 1 page on node 2 MEMORY|RW|DIRTY 00606000-00627000 rw-p 00000000 00:00 0 [heap] [0000000000606000-0000000000608000] 2 pages on node 2 MEMORY|RW|DIRTY 7ffff7dd8000-7ffff7ddd000 rw-p 00000000 00:00 0 [00007ffff7dd8000-00007ffff7dda000] 2 pages on node 2 MEMORY|RW|DIRTY [00007ffff7ddc000-00007ffff7ddd000] 1 page on node 2 MEMORY|RW|DIRTY 7ffff7fde000-7ffff7fe1000 rw-p 00000000 00:00 0 [00007ffff7fde000-00007ffff7fe1000] 3 pages on node 2 MEMORY|RW|DIRTY 7ffff7ffa000-7ffff7ffb000 rw-p 00000000 00:00 0 [00007ffff7ffa000-00007ffff7ffb000] 1 page on node 2 MEMORY|RW|DIRTY 7ffff7ffb000-7ffff7ffc000 r-xp 00000000 00:00 0 [vdso] [00007ffff7ffb000-00007ffff7ffc000] 1 page on node 7 MEMORY|SHARED 7ffff7ffe000-7ffff7fff000 rw-p 00000000 00:00 0 [00007ffff7ffe000-00007ffff7fff000] 1 page on node 2 MEMORY|RW|DIRTY 7ffffffea000-7ffffffff000 rw-p 00000000 00:00 0 [stack] [00007fffffffd000-00007ffffffff000] 2 pages on node 2 MEMORY|RW|DIRTY ffffffffff600000-ffffffffff601000 r-xp 00000000 00:00 0 [vsyscall] [ffffffffff600000-ffffffffff601000] 1 page on node 0 MEMORY|DIRTY|RESERVED _______________________________________________________________________________ |
The dlook(1) command generates the name of the process (Peek: sleep), the process ID, the time, and the date it was invoked. It provides total user and system CPU time in seconds for the process.
Under the Process memory map heading, the dlook(1) command generates information about a process from the /proc/pid/cpu and /proc/pid/maps files. On the left, it shows the memory segment with the offsets below in decimal. In the middle of the output, it shows the type of access, time of execution, the PID, and the object that owns the memory, which in this example is /lib/ld-2.2.4.so. The characters s or p indicate whether the page is mapped as sharable ( s) with other processes or is private (p). The right side of the output page shows the number of pages of memory consumed and shows the nodes on which the pages reside. A page is 16,384 bytes.
The node numbers reported by the dlook(1) command correspond to the numbers reported by the cpumap(1) command under the section Processor Numbering on Node(s). For more information, see the cpumap(1) command description in “Determining System Configuration” in Chapter 2.
Dirty memory means that the memory has been modified by a user.
Example 4-8. Using dlook(1) with a command
When you pass a command as an argument to dlook(1), you specify the command and optional command arguments. The dlook(1) command issues an exec call on the command and passes the command arguments. When the process terminates, dlook(1) prints information about the process, as shown in the following example:
$ dlook date

Thu Aug 22 10:39:20 CDT 2002
_______________________________________________________________________________
Exit:  date
Pid: 4680       Thu Aug 22 10:39:20 2002


Process memory map:
  2000000000030000-200000000003c000 rw-p 0000000000000000 00:00 0
        [2000000000030000-200000000003c000]         3 pages on node   3  MEMORY|DIRTY

  20000000002dc000-20000000002e4000 rw-p 0000000000000000 00:00 0
        [20000000002dc000-20000000002e4000]         2 pages on node   3  MEMORY|DIRTY

  2000000000324000-2000000000334000 rw-p 0000000000000000 00:00 0
        [2000000000324000-2000000000328000]         1 page  on node   3  MEMORY|DIRTY

  4000000000000000-400000000000c000 r-xp 0000000000000000 04:03 9657220    /bin/date
        [4000000000000000-400000000000c000]         3 pages on node   1  MEMORY|SHARED

  6000000000008000-6000000000010000 rw-p 0000000000008000 04:03 9657220    /bin/date
        [600000000000c000-6000000000010000]         1 page  on node   3  MEMORY|DIRTY

  6000000000010000-6000000000014000 rwxp 0000000000000000 00:00 0
        [6000000000010000-6000000000014000]         1 page  on node   3  MEMORY|DIRTY

  60000fff80000000-60000fff80004000 rw-p 0000000000000000 00:00 0
        [60000fff80000000-60000fff80004000]         1 page  on node   3  MEMORY|DIRTY

  60000fffffff4000-60000fffffffc000 rwxp ffffffffffffc000 00:00 0
[60000fffffff4000-60000fffffffc000] 2 pages on node 3 MEMORY|DIRTY |
Example 4-9. Using the dlook (1) command with the -s secs option
If you use the dlook(1) command with the -s secs option, the information is sampled at regular internals. The example command and output are as follows:
$ dlook -s 5 sleep 50
Exit:  sleep
Pid: 5617       Thu Aug 22 11:16:05 2002


Process memory map:
  2000000000030000-200000000003c000 rw-p 0000000000000000 00:00 0
        [2000000000030000-200000000003c000]            3 pages on node   3  MEMORY|DIRTY

  2000000000134000-2000000000140000 rw-p 0000000000000000 00:00 0

  20000000003a4000-20000000003a8000 rw-p 0000000000000000 00:00 0
        [20000000003a4000-20000000003a8000]            1 page  on node   3  MEMORY|DIRTY

  20000000003e0000-20000000003ec000 rw-p 0000000000000000 00:00 0
        [20000000003e0000-20000000003ec000]            3 pages on node   3  MEMORY|DIRTY

  4000000000000000-4000000000008000 r-xp 0000000000000000 04:03 9657225    /bin/sleep
        [4000000000000000-4000000000008000]            2 pages on node   3  MEMORY|SHARED

  6000000000004000-6000000000008000 rw-p 0000000000004000 04:03 9657225    /bin/sleep
        [6000000000004000-6000000000008000]            1 page  on node   3  MEMORY|DIRTY

  6000000000008000-600000000000c000 rwxp 0000000000000000 00:00 0
        [6000000000008000-600000000000c000]            1 page  on node   3  MEMORY|DIRTY

  60000fff80000000-60000fff80004000 rw-p 0000000000000000 00:00 0
        [60000fff80000000-60000fff80004000]            1 page  on node   3  MEMORY|DIRTY

  60000fffffff4000-60000fffffffc000 rwxp ffffffffffffc000 00:00 0
[60000fffffff4000-60000fffffffc000] 2 pages on node 3 MEMORY|DIRTY |
Example 4-10. Using the dlook (1) command with the mpirun(1) command
You can run a Message Passing Interface (MPI) job using the mpirun(1) command and generate the memory map for each thread, or you can redirect the ouput to a file.
In the following example, the output has been abbreviated and bold headings added for easier reading:
$ mpirun -np 8 dlook -o dlook.out ft.C.8 Contents of dlook.out: _______________________________________________________________________________ Exit: ft.C.8 Pid: 2306 Fri Aug 30 14:33:37 2002 Process memory map: 2000000000030000-200000000003c000 rw-p 0000000000000000 00:00 0 [2000000000030000-2000000000034000] 1 page on node 21 MEMORY|DIRTY [2000000000034000-200000000003c000] 2 pages on node 12 MEMORY|DIRTY|SHARED 2000000000044000-2000000000060000 rw-p 0000000000000000 00:00 0 [2000000000044000-2000000000050000] 3 pages on node 12 MEMORY|DIRTY|SHARED ... _______________________________________________________________________________ _______________________________________________________________________________ Exit: ft.C.8 Pid: 2310 Fri Aug 30 14:33:37 2002 Process memory map: 2000000000030000-200000000003c000 rw-p 0000000000000000 00:00 0 [2000000000030000-2000000000034000] 1 page on node 25 MEMORY|DIRTY [2000000000034000-200000000003c000] 2 pages on node 12 MEMORY|DIRTY|SHARED 2000000000044000-2000000000060000 rw-p 0000000000000000 00:00 0 [2000000000044000-2000000000050000] 3 pages on node 12 MEMORY|DIRTY|SHARED [2000000000050000-2000000000054000] 1 page on node 25 MEMORY|DIRTY ... _______________________________________________________________________________ _______________________________________________________________________________ Exit: ft.C.8 Pid: 2307 Fri Aug 30 14:33:37 2002 Process memory map: 2000000000030000-200000000003c000 rw-p 0000000000000000 00:00 0 [2000000000030000-2000000000034000] 1 page on node 30 MEMORY|DIRTY [2000000000034000-200000000003c000] 2 pages on node 12 MEMORY|DIRTY|SHARED 2000000000044000-2000000000060000 rw-p 0000000000000000 00:00 0 [2000000000044000-2000000000050000] 3 pages on node 12 MEMORY|DIRTY|SHARED [2000000000050000-2000000000054000] 1 page on node 30 MEMORY|DIRTY ... _______________________________________________________________________________ _______________________________________________________________________________ Exit: ft.C.8 Pid: 2308 Fri Aug 30 14:33:37 2002 Process memory map: 2000000000030000-200000000003c000 rw-p 0000000000000000 00:00 0 [2000000000030000-2000000000034000] 1 page on node 0 MEMORY|DIRTY [2000000000034000-200000000003c000] 2 pages on node 12 MEMORY|DIRTY|SHARED 2000000000044000-2000000000060000 rw-p 0000000000000000 00:00 0 [2000000000044000-2000000000050000] 3 pages on node 12 MEMORY|DIRTY|SHARED [2000000000050000-2000000000054000] 1 page on node 0 MEMORY|DIRTY ... |
For more information about the dlook(1) command, see the dlook(1) man page.