Once VCP-Recorder is installed and running you can monitor its operation using the tools mentioned in this chapter. Two tools, vtrstat and mcstat, work directly with VCP-Recorder. You can also use standard Silicon Graphics IRIX tools to monitor various system resources.
There are two tools that monitor VCP-Recorder directly:
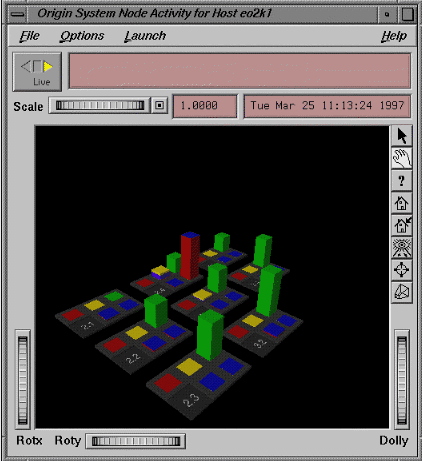
mcstat is the graphical version of vtrstat. Both tools monitor VCP-Recorder operations.
This chapter describes how to monitor VCP-Recorder in the following sections:
vtrstat is a command line tool that tells you:
Whether or not VCP-Recorder is running.
Which units are open, using the -units option.
Which media ports are available, using the -ports option.
Example 8-1 shows an example output of vtrstat.
kruger 87# /usr/vtr/bin/vtrstat -units VCP-Recorder on kruger is running. Unit Owner Port Clip Function Location ---------------------------------------------------------- U1 louth DIVO_0 d/REC12 STOP 01:04:30.05 U2 louth DIVO_0 * STOP * U3 louth DIVO_1 d/rPOP CUE 00:00:00.00 U4 louth DIVO_1 d/rSEL STOP 00:00:00.00 U5 louth DIVO_1 d/REC01 STOP 01:04:30.06 U6 louth DIVO_1 * STOP * U7 louth DIVO_0 d/rSEL CUE 00:00:00.00 U8 louth DIVO_0 d/rSTOK STOP 00:03:30.01 U9 louth DIVO_7 d/rJOR CUE 00:00:00.00 U10 louth DIVO_7 d/rSEL STOP 00:00:00.00 U11 louth DIVO_3 d/rPOP CUE 00:00:00.00 U12 louth DIVO_3 d/rSTOK PLAY 00:03:02.29 U13 louth DIVO_4 d/rSEL CUE 00:00:00.00 U14 louth DIVO_4 d/rSTOK STOP 00:00:00.00 U15 louth DIVO_5 d/rSEL CUE 00:00:00.00 U16 louth DIVO_5 d/rSTOK STOP 00:03:30.01 kruger 88# /usr/vtr/bin/vtrstat -ports VCP-Recorder on kruger is running. # Port Type Description ---------------------------------------------------------- 0 vlan_1 Deck VLAN Deck Control 1 DIVO_0 Video SGI XT-DIVO Digital Video Option 2 DIVO_1 Video SGI XT-DIVO Digital Video Option 3 DIVO_3 Video SGI XT-DIVO Digital Video Option 4 DIVO_4 Video SGI XT-DIVO Digital Video Option 5 DIVO_5 Video SGI XT-DIVO Digital Video Option 6 DIVO_6 Video SGI XT-DIVO Digital Video Option 7 DIVO_7 Video SGI XT-DIVO Digital Video Option |
mcstat is the graphical equivalent of vtrstat. mcstat tells you:
Whether or not VCP-Recorder is running.
Which units are open.
Which media ports are available.
Figure 8-1 shows an example of mcstat's output.

For more information about mcstat, see the mcstat User's Guide.
Silicon Graphics provides a compendium of monitoring tools that can be used with VCP-Recorder, including
sar—system activity reporter, reports operating system activity.
gr_osview—graphical system monitor, graphically displays real-time usage of certain system resources.
pcp—Performance Co-Pilot, serves as an interface for existing reporting tools, such as graphing performance data over time.
Before exporting media data recorded by VCP-Recorder to IRIX tools, you must manipulate the data. For more information about exporting media data, see Chapter 7, “Managing Clips,” “Exporting VCP-Recorder Clips”.
sar, the System Activity Reporter, is an activity counter. The command line options allow you to specify the kinds of activities you want measured. You can, for example, display disk utilization.
To use sar, use the following procedure:
Enable sar using the following command:
# chkconfig sar on
Reboot your system.
When your system reboots, the sar data collector starts.
Specify the system activity you want sar to measure, for example, to measure disk utilization, use a command similar to the following:
# sar -d 2 10
The -d command line option specifies the display of disk utilization. The numbers, 2 and 10, specify how often you want to take reports. In this example, 10 reports are taken every 2 seconds.
 | Note: For a complete list of sar command line options, see the sar man page. |
Example 8-2 shows an example output of sar.
kruger 100# sar -d 2 10 IRIX64 kruger 6.4 02121744 IP27 12/19/1997 11:15:10 device %busy avque r+w/s blks/s w/s wblks/s avwait avserv 11:15:12 dks2d1 8 1.0 3 12002 0 0 0.0 28.3 dks3d69 8 1.0 1 12257 0 0 0.0 53.3 dks0d1 8 5.4 7 120 7 120 49.3 11.3 dks1d1 0 0.0 0 0 0 0 0.0 0.0 dks0d2 0 0.0 0 0 0 0 0.0 0.0 dks1d2 0 0.0 0 0 0 0 0.0 0.0 dks0d3 0 0.0 0 0 0 0 0.0 0.0 dks1d3 0 0.0 0 0 0 0 0.0 0.0 dks0d4 0 0.0 0 0 0 0 0.0 0.0 dks1d4 0 0.0 0 0 0 0 0.0 0.0 dks0d5 0 0.0 0 0 0 0 0.0 0.0 dks1d5 0 0.0 0 0 0 0 0.0 0.0 dks0d6 0 0.0 0 0 0 0 0.0 0.0 dks1d6 0 0.0 0 16 0 16 0.0 0.0 |
gr_osview provides a graphical display of system resources usage. This display provides a real-time window into the overall operation of the system, as shown in Figure 8-2.

For more information about gr_osview, see its man page.
Performance Co-Pilot (PCP) provides a suite of tools that co-operate to deliver distributed, integrated performance-monitoring and performance-management services across a spectrum of performance domains, as shown in Figure 8-3.
For more information about Performance CoPilot, see its man page.